What is Donor Retention Rate? How to Calculate and Use DRR
In this article
- What is the Donor Retention Rate (DRR) in fundraising?
- How to Calculate Donor Retention Rate (DRR)
- Different ways to measure DRR (yep, there’s more than one!)
- Why is measuring Donor Retention Rate in fundraising important?
- Tracking Donor Retention Rate
- Tools for tracking DRR
- Tips for the accurate calculation of Donor Retention Rate
- Challenges in tracking Donation Retention Rates
- Strategic applications of DRR tracking
- What is a good Donor Retention Rate in fundraising?
- Recommended DRR growth benchmarks
- Strategies to achieve DRR growth benchmarks
- Donor Retention Rate Case Studies
- Start tracking Donor Retention Rate (DRR) with RallyUp
- Common Donor Retention Rate questions answered
What is the Donor Retention Rate (DRR) in fundraising?
Think of Donor Retention Rate like a boomerang.
When you throw your message out into the world—will it come back? DRR tells you if it does. It shows how many of your donors circled back with another gift, instead of flying off into the fundraising void forever.
Why does it matter?
Because acquiring new donors is like swiping right. Sometimes it leads somewhere. Often, it’s just awkward. But a donor who comes back? That’s someone who didn’t just give impulsively—they felt a connection strong enough to return.
Strong DRR = sticky relationships
It means your follow-up wasn’t a ghost town. It means your thank-you note didn’t sound like it was written by a tax receipt generator. It means people felt seen, not spammed.
Low DRR? That’s donors treating your cause like a pop-up ad.
High DRR? That’s a donor saying, “You again? I like that.” It’s loyalty without needing a punch card.
So yes, DRR is a number—but it’s also proof you’re not yelling into the void.
It’s the difference between a one-time gift and a real conversation. Between a “maybe” and a “still here.”
And every time a donor comes back, that boomerang lands right in your hand.
It’s how you know your thank-yous meant something. That your updates hit home. That your donors aren’t just donors—they’re believers.
And the best part? Every percentage point up means more people who said, “I’m in”—again. And again. And again.
Story time. Meet Sarah.
She’s not a metaphor. She’s not a case study. She’s a real person (okay, not really—but go with it). Sarah gave $50 to a local animal shelter because she loves dogs and has a soft spot for wagging tails. She clicked donate, felt that warm fuzzy glow, and then… nothing.
No thank-you. No update. No “Hey, Sarah, look what your gift did!”
Just the digital equivalent of tumbleweed and sad violin music.
You know what that feels like?
Like you showed up for a first date and your date didn’t. Just a chair. Maybe some breadsticks if you’re lucky.
Now—flip the script.
Same Sarah, same $50. But this time, the shelter sends her a video of a slobbery rescue pup doing zoomies with a sign that says, “Sarah, you made this tail wag.” Boom. Instant connection. Sarah laughs. She melts a little. She forwards it to her group chat. And the next time she gets paid? She’s back.
That right there? That’s DRR in action.
It’s not about numbers on a spreadsheet. It’s about feelings. Delight. Recognition. The kind of moment that makes someone say, “These are my people.”
Because donors don’t ghost when they feel like they matter.
They stick around. They give again. And if you’re really nailing it, they bring friends.
So don’t leave your Sarah hanging.
Make her laugh. Make her feel something. Make her want to hit “donate” again because you gave her more than a receipt. You gave her a reason.

How to Calculate Donor Retention Rate (DRR)
Ready to measure how many donors came back for more?
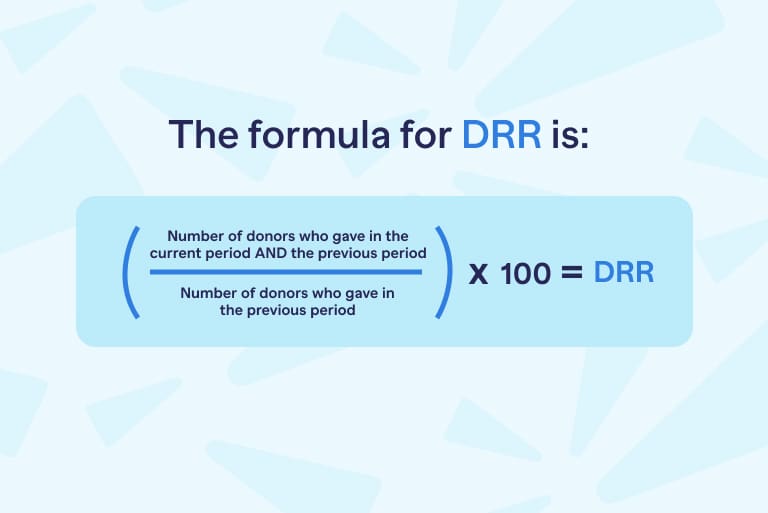
The formula for DRR is:
DRR = (Number of donors who gave in the current period AND the previous period÷ Number of donors who gave in the previous period) × 100
To calculate DRR accurately, follow these steps:
 Set your time frame
Pick your comparison period. Usually, that’s:
- A full year (like Jan 1 to Dec 31)
- Or maybe a shorter one (like a quarter) for specific campaigns
Pro tip: Make sure the two time periods match up—like 2023 vs. 2024.
Find your donors from the previous period
Now, grab a list of all unique donors from your starting period (e.g., 2023). Use your CRM—Salesforce, DonorPerfect, whatever you’ve got.
- Only count people who actually donated
- If someone gave three times? Count them once.
- Skip non-donors like Event attendees or volunteers who didn’t give
See who returned this period
From that 2023 list, check how many of those same folks donated again in 2024.
- Match by donor ID, name, or email
- Be careful with duplicates or name changes (marriage, typos—you know the drill)
- Again, just count unique returning donors
Plug in the numbers
Here’s a real-world example:
- 2023: You had 1,200 unique donors
- 2024: 720 of them came back and gave again
Time to use the formula: Donor Retention Rate (DRR) = (Retained Donors ÷ Previous Donors) × 100
So for this case: DRR = (720 ÷ 1,200) × 100 = 60%
Result: The DRR is 60%, meaning 60% of 2023 donors continued to give in 2024.
Different ways to measure DRR (yep, there’s more than one!)
Not all donors are the same—and your DRR shouldn’t be either. Depending on what you’re trying to learn, you can slice it in a few different ways:
 First-time donor retention
Start here if you’re curious about how well you’re keeping brand-new supporters.
- Look only at the folks who donated for the first time (say, 2023).
- Then check how many came back (2024).
- Example: If 300 out of 500 newbies returned? That’s a 60% first-time DRR.
This stat matters. First-timers are harder to keep—the industry average is just 20–30%. So, if you’re above that? You’re doing something right.
Segmented DRR
Want a sharper view? Break things down by donor type. Run DRR for specific groups like:
- Major donors ($1,000+ givers)
- Monthly/recurring donors
- Small-dollar donors (like under $50)
Example: Let’s say you had 100 major donors in 2023, and 50 of them gave again in 2024. That’s a 50% DRR just for that group.
Segmented DRR shows you who’s most loyal—and where to focus your energy.
Multi-year Retention
Think bigger. Instead of looking at just two years, track how many donors stick with you over time—like across 2021, 2022, 2023, and beyond.
It’s more complex, but it tells you who’s truly in it for the long haul.
Gift-based Retention
This one’s less common, but still useful. Instead of tracking people, you look at the number or value of gifts.
Are donors giving more over time? Giving the same amount? Dropping off? That’s what this method shows. Just know: most teams stick with donor-based DRR.
No need to crunch all this by hand. Most donor databases have a “retention” or “repeat donor” report built in.
Not all donors are the same—and your DRR shouldn’t be either. Depending on what you’re trying to learn, you can slice it a few different ways:
Filter by donor type, date range, gift size—you name it.
- Quick tip: use your CRM to speed things up!
- Real example: DRR by donor segment
Let’s say you’re analyzing 2024 numbers and want the full picture:
- Total Donors: 1,200 in 2023 → 720 returned → DRR = 60%
- First-Time Donors: 400 in 2023 → 100 returned → DRR = 25%
- Major Donors ($1,000+): 50 in 2023 → 40 returned → DRR = 80%
What does that tell you? Major donors are showing love. First-time folks? Not so much. Time to dial up the welcome experience.
Why is measuring Donor Retention Rate in fundraising important?
Donor retention equals smart money moves
Keeping your current donors? Way cheaper than chasing new ones. That’s why a strong DRR isn’t just a nice-to-have—it’s your financial backbone.
- Less spend, more win
New donors are pricey. Think ads, Events, cold outreach. In fact, bringing in a fresh donor can cost 5 to 10 times more than keeping someone you already have. A solid DRR cuts those costs and frees up your budget for things that actually move the mission forward.
- Steady, predictable revenue
Repeat donors, especially monthly givers, mean you’re not guessing when the next check comes in. High DRR = reliable income, better budgets, and fewer financial curveballs.
- Bigger lifetime value
The longer someone sticks with you, the more they tend to give. Some even step up as major donors or leave a legacy gift. Tracking DRR helps you spot these gems and build real relationships.
💡Aha! Moment: Keeping fundraising projects small (under $400) and pairing them with matching funds encourages repeat giving. This strategy works because donors see immediate impact and feel their gift is doubled, increasing their likelihood of returning. A teacher might post, “Your $50 donation, matched by a partner, fully funded our classroom library!”
DRR: your donor happiness radar
Want to know if your donors are happy, engaged, and sticking around? DRR tells the story.
- Loyalty check
A high DRR means people feel seen, appreciated, and aligned with your mission. If it dips? That’s a red flag—maybe donors feel ignored, disconnected, or unsure where their money’s going.
- Stewardship scorecard
DRR is your feedback loop. Did your new thank-you series land? Is your impact report hitting home? Watch what DRR does. If it climbs, you’re doing something right.
- Early warning system
A falling DRR is your signal to act fast. Something’s off—maybe your messages feel generic or your impact isn’t clear. Fix it early, before donors check out for good.
Real-life case: One nonprofit saw its DRR drop from 50% to 35% over two years. Why? Donors said the thank-you emails felt robotic. Once the org stepped up with personalized notes and updates, retention started climbing again.
Tackling donor attrition: stop the drop-off
Truth be told—losing donors stings. But DRR helps you catch the problem and fix it before it gets worse.
- Find out why they left
A low DRR is your cue to dig in. Are donors facing financial issues? Did your messages miss the mark? Ask them. Surveys and follow-ups with lapsed donors can reveal exactly what went wrong—and what to do next.
- Bring them back
Just because someone stopped giving doesn’t mean they’re gone forever. DRR helps you spot lapsed donors and hit them with a smart re-engagement campaign. Think “We Miss You” emails or special appeals designed just for them.
- Stop the leaks early
When you know why donors leave, you can stop others from walking out the door. Maybe your updates were too rare. Maybe they didn’t feel seen. Whatever the issue, fixing it now means a higher DRR later.
💡Aha! Moment: Create a monthly “Donor Spotlight” post on X, Instagram, TikTok or Facebook, sharing a donor’s story or impact with their consent.
Quick win example: A nonprofit had a 30% DRR. After surveying donors, they learned folks weren’t sure where their money went. Solution? More transparent impact reports. Result? DRR jumped to 40% the next year.
Retention = Relationship Building
At its core, donor retention isn’t about dollars. It’s about people. It’s about building trust, connection, and community.
- Trust fuels loyalty
When donors believe in your work—and see proof—it shows up in your DRR. High DRR means they trust you to follow through and make change happen.
- Pathway to bigger things
Donors who stick with you are the ones who level up. Today’s $25 giver could be next year’s major donor, board member, or champion. DRR helps you spot those rising stars early.
- Your people, your champions
Loyal donors don’t just give—they talk. They spread the word, bring friends, and grow your movement. Strong DRR = stronger community, inside and out.

Tracking Donor Retention Rate
Want to really know how well you’re keeping donors around? Tracking your Donor Retention Rate (DRR) takes solid data, smart systems, and regular check-ins. Here’s how to get it done—without the overwhelm.
1. Start with clean, centralized data
First things first: if your donor info is scattered across spreadsheets and sticky notes, it’s time to centralize.
- Use a CRM that works for you
Pick a donor management system like Salesforce, Kindful, or DonorPerfect. It’s your digital donor vault—names, emails, gifts, dates—it should all live here.
- Assign unique donor IDs
This is key. IDs help you track each person without getting tripped up by duplicates, name changes, or typos.
- Track every gift
Whether it’s $5, a monthly pledge, or in-kind support, log it all—with dates. That’s how you spot who gave when.
- Clean it up regularly
Set a reminder to tidy your data: merge duplicates, update addresses, fix errors. Good data = good DRR insights.
2. Define your time frames and donor groups
Consistency is your friend here.
- Pick a time period
Most orgs track DRR yearly (2023 vs. 2024), but you can go quarterly or by campaign if it fits your strategy.
- Segment your donors
Break donors into useful groups so you can see what’s working where. Try:- First-time donors (newbies last year)
- Recurring donors (monthly givers)
- Major donors ($1,000+)
- Lapsed donors (no gift this year)
- Track over multiple years
Want to see who’s really in it for the long haul? Check how many gave in 2021, 2022, and 2023. That’s loyalty gold.
3. Run the numbers—often
Don’t wait for year-end surprises. DRR works best when you check in regularly.
- How often?
At minimum, calculate annually. But quarterly or campaign-specific checks give you faster feedback.
- Use your CRM’s power
Most platforms can calculate DRR for you. Set up automated reports so it runs in the background while you focus on strategy.
- No CRM? No Problem
You can do it manually in Excel or Google Sheets. Just export your data, use formulas like VLOOKUP or MATCH, and compare this year’s donors to last year’s.
4. Look for patterns—and learn from them
DRR isn’t just a number—it’s a story. So, dig into it.
- Spot the trends
Is your DRR going up over time? Dropping in certain years? That’s the insight you can act on.
- Break it down by segment
Which donors stick around? Which don’t? Analyze by donor type, gift size, or how they came in (online vs. in-person Events).
- Consider what’s going on around you
Big campaign last year? Leadership change? Economic downturn? External factors can impact retention—factor them into your analysis.

Tools for tracking DRR
Tracking your DRR doesn’t have to be a data headache. With the right tools, it’s quick, clear, and surprisingly satisfying. Here’s how to do it right:
Donor management systems / CRMs
These are your donor data workhorses.
- Popular picks: DonorPerfect, NeonCRM, Kindful, Salesforce NPSP
- Key features: Built-in retention reports, gift tracking, auto-updates, and segmentation tools
- Use case: Run a “Donor Retention” report for a specific period (like 2023–2024), or filter by donor type—first-timers, recurring, major gifts, etc.
Spreadsheets
When you want control and flexibility, spreadsheets still deliver.
- Tools: Microsoft Excel, Google Sheets
- What they do: Manual DRR calculations, filtering, pivot tables, simple charts
- Use case: Export donor lists from 2023 and 2024. Use formulas like COUNTIF to find matches. Then calculate DRR using (retained donors ÷ total donors last year) × 100.
Data visualization tools
These tools make trends jump off the page.
- Examples: Tableau, Power BI, Google Data Studio
- What they’re for: Visualizing retention rates, segment trends, and year-over-year changes
- Use case: Build a dashboard that shows DRR by donor segment or campaign, so you can see what’s working and what needs love.
Survey and feedback tools
Numbers show the trend. Feedback shows the reason.
- Examples: SurveyMonkey, Google Forms, Typeform
- What they do: Capture insights from real donors—especially the ones who stopped giving
- Use case: Send a survey to lapsed donors to ask why they stopped giving. Use those insights to improve retention efforts next year.
Accounting software
Good data starts with clean financials.
- Examples: QuickBooks, Xero
- Why it matters: Ensures all gifts are recorded properly before syncing with your CRM
- Use case: Cross-check donation records in your accounting system with CRM data before running DRR reports—no missing gifts, no surprises.
 Want to keep donors coming back? Check this out:
Tracking your Donor Retention Rate doesn’t have to be a guessing game. With RallyUp, you get the tools to actually see what’s working—and fix what’s not. With Donor Profiles, view donor history in real time, send smart follow-ups with email automation, and get campaign insights that show you exactly who’s sticking around.
You can even plug RallyUp into your favorite CRM to go deeper with your data. And yes, you can generate detailed reports that track donor trends over time—so you’re not just reacting, you’re planning.
Retention starts with clarity. RallyUp delivers it.
Get Started with RallyUpTips for the accurate calculation of Donor Retention Rate
Let’s talk strategy!
There’s no one-size-fits-all. It’s all about what fits your goals and tools. Here’s how to pick your path:
📌 Go annual for the big picture
Track DRR once a year—simple, solid, and tells you who stuck around from, say, 2023 to 2024.
Perfect if your fundraising calendar is steady and your donor base isn’t bouncing around.
📌 Zoom in with segment tracking
Want sharper insights? Slice it up:
- First-time donors: How good is your welcome game?
- Major donors: Are your VIPs still with you?
- Recurring donors: Is your monthly program really sticking?
Example: A DRR of 25% for first-timers vs. 80% for major donors? Time to beef up your new donor love!
📌 Track by campaign
Just wrapped a big appeal or Event? See if those donors came back.
Example: If 500 folks gave during your 2023 year-end push, check how many showed up again in 2024. That tells you if the campaign had staying power.
📌 Stay fresh with rolling retention
No need to wait for year-end. A rolling 12-month DRR gives you ongoing feedback.
Awesome for orgs with regular giving—like monthly donors.
📌 Play the long game with multi-year tracking
Want to find your forever fans? Track who gave in 2021—and kept showing up in 2022, 2023, and 2024.This one’s gold for spotting long-term loyalty and “evergreen” donors.
Challenges in tracking Donation Retention Rates
Let’s be real—tracking DRR isn’t always a walk in the park. It can get messy. But every challenge has a fix. Let’s break it down:
 Data drama? Clean it up.
The problem: Duplicate records. Missing gifts. Out-of-date info. One bad entry can throw off your whole DRR.
The fix: Run regular data clean-ups, use your CRM’s deduping tools, and make sure your team’s trained on what good data looks like.
Everyone’s defining “donor” differently
The problem: Are you counting in-kind gifts? Pledges? Event tickets? If your team isn’t aligned, your numbers won’t be either.
The fix: Get crystal clear. Write down what counts and stick to it. A simple data policy goes a long way.
Short on staff or tech?
The problem: Smaller orgs might not have the fancy tools or the people power to track DRR like the big players.
The fix: Don’t sweat it. Affordable CRMs like Little Green Light or even Google Sheets can do the job. Start with annual tracking—keep it lean and meaningful.
Donors come from everywhere—now what?
The problem: Was that donor from your gala, email blast, or Facebook ad? Multi-channel giving makes DRR tracking tricky.
The fix: Tag it! Use your CRM to mark where each donor came from. Then slice your DRR by channel for smarter insights.
When the world throws a curveball
The problem: Stuff happens. Economic downturns, leadership shakeups, or that one viral campaign can make DRR go weird.
The fix: Don’t panic. Always zoom out. Look at multi-year trends, not just one bumpy season.
Strategic applications of DRR tracking
Donor Retention Rate (DRR) is your gem for smarter, sharper fundraising decisions.
Keep more donors around
Got a low DRR? Say, around 30%? Time to level up.
- Drop in a thank-you email that actually sounds like a human wrote it.
- Share impact stories that give donors goosebumps.
- Create recognition moments that feel personal.
See if this story can change your perspective.
Find out what works—and double down
Not all donors are created equal. Some stick. Some don’t.
- Track DRR by channel: Were they pulled in from an Event, or did they click on an ad?
- If Event donors have a 60% DRR and ad donors only 20%? You’ve got your marching orders—go all in on Event-based campaigns.
Win back the ones who left
Lapsed donors aren’t lost. They’re just waiting for the right message.
- Use DRR to flag who’s dropped off, then launch a win-back campaign.
- Make it personal. Show them what they missed.
💡Aha! Moment: Hosting ‘Donor Appreciation Zoom Parties’ with live Q&A can boost your retention rate by10%.
Forecast like an expert
DRR helps you see what’s coming. Say you’ve got 1,000 donors and a 50% DRR?
You can count on 500 sticking with you next year. That’s planning power. Use it to set smarter revenue goals.
Check out this donor persona journey that shows how cutting-edge tech can enhance donor retention.
Beef up grant applications
Funders want proof you’re doing something right. Show them your DRR.
Example: A 60% DRR shows loyal support—and adds major credibility to your proposal.
Measure the real impact of campaigns
Did last year’s campaign bring in loyal donors—or one-and-dones? Track DRR from each campaign to find out.
Example: If a 2023 crowdfunding push ends with just 15% retention, it might be time to rethink the strategy.
Let’s look at how a mid-sized nonprofit used DRR to tune up its fundraising game—and what they learned.
| The Snapshot | |
|---|---|
| 2023 donor base | |
| Total donors | 2,000 |
| First-time donors | 500 |
| Major donors | 100 |
| 2024 retention | |
| Total retained donors | 1,200 |
| Returning first-time donors | 100 |
| Returning major donors | 90 |
| The Numbers That Matter | |
|---|---|
| Overall DRR | (1,200 ÷ 2,000) × 100 = 60% |
| Nice. That’s well above the typical 40–50%. | |
| First-time donor DRR | (100 ÷ 500) × 100 = 20% |
| Yikes. That’s low. Time to fix that welcome journey. | |
| Major donor DRR | (90 ÷ 100) × 100 = 90% |
| Boom. That’s loyalty. Major donors are clearly feeling love. |
| What It All Means | |
|---|---|
| Overall DRR | 60% overall DRR? Solid. You’re keeping your base engaged. |
| First-time DRR | 20% for first-timers? Red flag. First impressions need work. |
| Major donor DRR | 90% for majors? Gold. Keep doing what you’re doing with those VIPs. |
| What to Do Next | |
|---|---|
| First-time fix | Launch a welcome series that actually welcomes. Think personalized emails, short impact stories, and a “thanks for jumping in” vibe. |
| Major donor love | Keep the one-on-one touches going—calls, custom updates, real gratitude. |
| Quarterly check-ins | Don’t wait a year. Start tracking DRR every quarter to catch trends early. |
What is a good Donor Retention Rate in fundraising?
Donor Retention Rate growth benchmark
Want to know if your donor retention rate is strong—or slipping? Here’s the lay of the land based on the latest 2024–2025 data from Fundraising Effectiveness Project, Fundraising Report Card, and more.
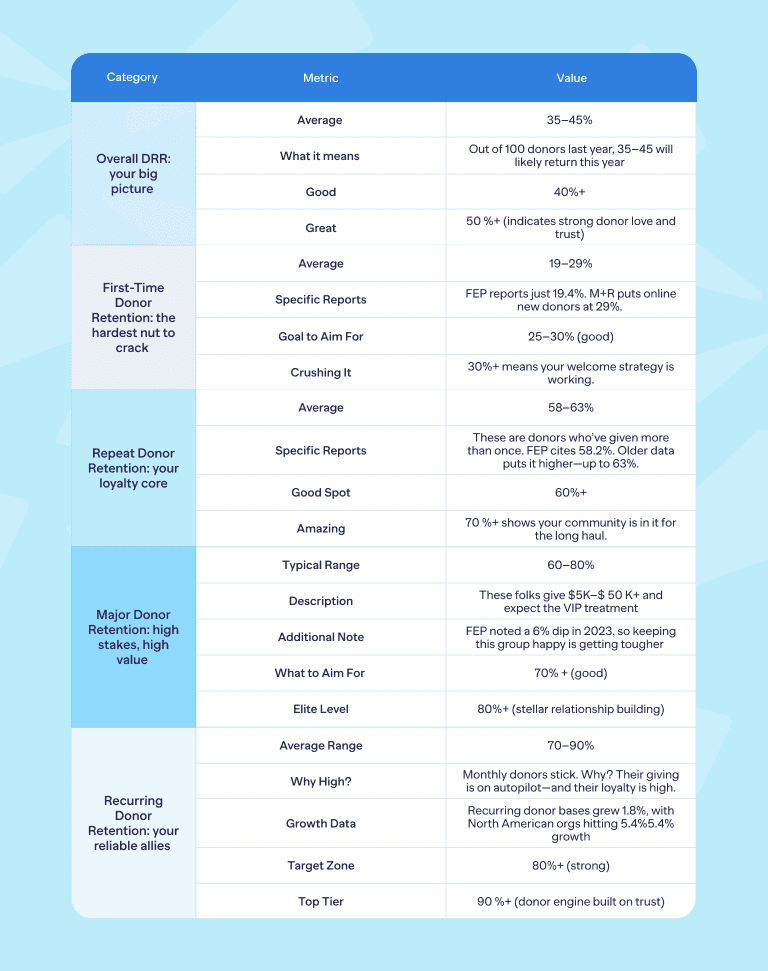
| Category | Metric | Value |
|---|---|---|
| Overall DRR: your big picture | Average | 35–45% |
| What it means | Out of 100 donors last year, 35–45 will likely return this year | |
| Good | 40%+ | |
| Great | 50 %+ (indicates strong donor love and trust) | |
| First-Time Donor Retention: the hardest nut to crack | Average | 19–29% |
| Specific Reports | FEP reports just 19.4%. M+R puts online new donors at 29%. | |
| Goal to Aim For | 25–30% (good) | |
| Crushing It | 30%+ means your welcome strategy is working. | |
| Repeat Donor Retention: your loyalty core | Average | 58–63% |
| Specific Reports | These are donors who’ve given more than once. FEP cites 58.2%. Older data puts it higher—up to 63%. | |
| Good Spot | 60%+ | |
| Amazing | 70 %+ shows your community is in it for the long haul. | |
| Major Donor Retention: high stakes, high value | Typical Range | 60–80% |
| Description | These folks give $5K–$ 50 K+ and expect the VIP treatment | |
| Additional Note | FEP noted a 6% dip in 2023, so keeping this group happy is getting tougher | |
| What to Aim For | 70% + (good) | |
| Elite Level | 80%+ (stellar relationship building) | |
| Recurring Donor Retention: your reliable allies | Average Range | 70–90% |
| Why High? | Monthly donors stick. Why? Their giving is on autopilot—and their loyalty is high. | |
| Growth Data | Recurring donor bases grew 1.8%, with North American orgs hitting 5.4%5.4% growth | |
| Target Zone | 80%+ (strong) | |
| Top Tier | 90 %+ (donor engine built on trust) |
What’s a “good” DRR? Well… it depends
Not all DRRs are created equal. What looks great for one organization might be average for another. Here’s the real talk on what shapes your donor retention rate—and what “good” actually means for you.
The context behind the numbers
 Organization size
Smaller shops often shine here. Why? They’ve got tighter bonds with donors. Some pull a 46% DRR or better (CCS Fundraising says so).
Big orgs? They have scale—but that can mean more distance, and lower retention.
Your mission
If your cause feels urgent—think disaster relief or health—donors stick around. Emotional pull = better DRR.
Less immediate missions like arts or education? You might need stronger storytelling to hold on to folks.
How you got them
Donors who came in through Events or Peer-to-Peer fundraising? They tend to hang around longer—up to 50–60%.
Those from digital ads? Often drop off fast—20–30% is common.
The Economy
Inflation, job loss, shaky markets—yep, they hit your DRR. Micro-donors (under $500) are usually the first to pause giving when budgets tighten.
Donor age
Boomers (around age 65)? Loyal. They give, and they come back.
Younger donors—Millennials, Gen Z? Not as sticky. Budgets are tighter, and giving isn’t always a habit yet.
So… what’s a “good” DRR?
Here’s your cheat sheet for realistic (and bold) targets:
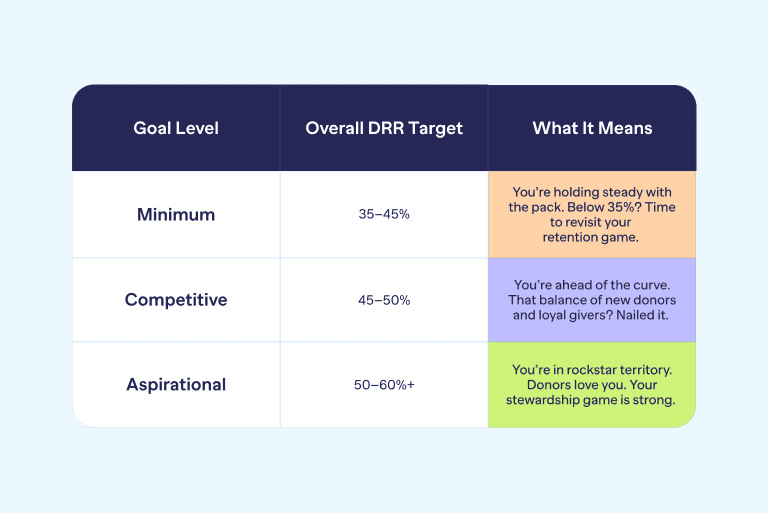
| Goal Level | Overall DRR Target | What It Means |
|---|---|---|
| Minimum | 35–45% | You’re holding steady with the pack. Below 35%? Time to revisit your retention game. |
| Competitive | 45–50% | You’re ahead of the curve. That balance of new donors and loyal givers? Nailed it. |
| Aspirational | 50–60%+ | You’re in rockstar territory. Donors love you. Your stewardship game is strong. |
Zoom In: DRR goals by donor type
First-time donors:
Target: 25–30% (Better than the usual 19–29%)
Why it matters: Great onboarding = future loyalists.
Repeat donors:
Target: 60–70%
Why it matters: These are your core. Keep them engaged and appreciated.
Major donors:
Target: 70–80%
Why it matters: These folks give big—your job is to make them feel seen.
Recurring donors:
Target: 80–90%
Why it matters: They’re already all-in. Keep the connection strong, and they’ll stay.
Recommended DRR growth benchmarks
How fast should your DRR grow?
Not every nonprofit starts from the same spot. So your growth target? It depends on where you are now—and how much capacity you’ve got to move the needle. Here’s your roadmap:
💡Low starting DRR (under 35%)
Growth goal: Bump it up 5–10% over the next 1–2 years.
Why: When DRR is low, small changes make a big impact. You’ve got room to grow—and fast.
Quick win: Start with the basics. Thank-you notes. Welcome emails. Show donors where their dollars go.
True story: A nonprofit jumped its DRR from 30% to 35% in one year just by launching a donor welcome series and spotlighting monthly giving.
💡Average DRR (35–45%)
Growth goal: Push for a 3–5% increase in 1–2 years.
Why: You’re close to the industry average. Now’s the time to get strategic—segment donors, start a monthly giving option, and engage more deeply.
Example: A jump from 40% to 43% after rolling out a recurring donor program.
💡High DRR (45–50%+)
Growth goal: Maintain or grow slowly—1–3% a year.
Why: You’re already strong. Gains get harder, so focus on fine-tuning. Think personalization, donor journeys, and retention tech.
Example: From 50% to 52% using AI to spot donors likely to lapse—and catching them early.
💡Segment-specific growth targets

Strategies to achieve DRR growth benchmarks
How to grow your DRR (without burning out)?
Want to hit your DRR goals? Great—because there’s a smart, proven playbook to get there. These aren’t random tactics—they’re targeted, practical moves built for real-world nonprofits.
Let’s break it down by strategy:
 Nail the first impression (first-time donors)
What to do: Roll out a welcome series—email, video, even mail. Say thanks. Share a short impact story. Make them feel like they belong. Do it within 30 days.
Real-World Win: One org jumped from 20% to 25% retention by sending a welcome email with a heartfelt video from their executive director.
Why it works: You’ll lift first-time donor retention by 5–10%. That’s huge.
Talk to the right people the right way (all donors)
What to do: Use your CRM to slice and dice your list—by gift size, interest, how they came in. Then tailor the message.
Example: A group boosted DRR from 40% to 43% just by customizing their impact reports.
Why it works: A personal touch raises DRR 2–5%. And it builds trust.
Get monthly giving on every page (new + repeat donors)
What to do: Add recurring options to every donation form. Use data tools to spot likely monthly givers.
Proof: Since 2019, recurring giving revenue’s up nearly 27%. North America’s seen a 5.4% jump in monthly donors.
Why it works: Retention jumps to 80–90% for recurring donors. And DRR grows 3–5%.
Go big on stewardship (major + repeat donors)
What to do: Think beyond the thank-you. Host appreciation events. Send handwritten notes. Give sneak peeks into your impact.
Real Example: One nonprofit kept 75% of major donors by hosting annual dinners and sending custom updates.
Why it works: A solid stewardship plan keeps major donors coming back. Think 1–3% DRR lift or more.
Win back the wanderers (lapsed donors)
What to do: Don’t let them drift away. Send a “We miss you!” message. Show them what their past support made possible.
Real Example: One group moved from 38% to 40% DRR after recovering 5% of lapsed donors with a re-engagement email series.
Why it works: You can snag a 1–3% DRR boost with just a few thoughtful nudges.
Let the data work for you (all donors)
What to do: Use tools like Dataro or Fundraising KIT to spot who’s about to lapse—and act before it happens.
In Action: Nonprofits using predictive insights saw meaningful DRR growth by jumping in at the right time.
Why it works: Predictive tech can drive DRR up 2–5%—without more guesswork.
Ask, listen, adjust (all donors)
What to do: Send a quick survey. Call a few donors. Ask what’s working—and what’s not.
Example: One org boosted DRR from 42% to 45% just by fixing how often they emailed people.
Why it works: Listening leads to loyalty. Expect a 1–3% DRR lift when you align with donor preferences.
Final verdict:
DRR growth doesn’t happen by accident. It comes from intention, experimentation, and listening to your donors like they matter—because they do. Which strategy will you try first?
Donor Retention Rate Case Studies
Want to see what DRR growth really looks like in action? Let’s dig into some examples—from small grassroots orgs to major players with national reach. These stories show how nonprofits of all shapes and sizes hit (and often surpass) their donor retention goals by putting data to work, leaning into smart tech, and staying laser-focused on their donors.
Below you’ll find a case-style snapshot across different nonprofit types, donor segments, and situations. Each one breaks down the full picture: the org’s background, where they started, what they aimed for, what they did, how they tracked progress—and what actually changed.
Think of it as your DRR strategy playbook, built on what works.
Start tracking Donor Retention Rate (DRR) with RallyUp
RallyUp is more than a fundraising platform; it’s packed with tools that directly support donor retention (DRR) when used strategically.
 Recurring giving setup
Tool: Built-in recurring donation options
DRR boost: Monthly donors retain at 80–90%.
How to use it: Enable recurring giving on all campaign and donation pages. Frame it with mission-driven language (“Join our Rescue Circle” or “Be a Monthly Changemaker”).
 Customizable thank-you messages
Tool: Automated and personalized thank-you emails/messages
DRR boost: Donors are more likely to return when they feel appreciated.
How to use it: Customize your thank-you notes with donor names, specific gift impact, or even video thank-yous from your team or beneficiaries.
 Peer-to-Peer & team fundraising
Tool: Peer-to-Peer fundraising tools
DRR boost: Donors acquired through personal networks (friends, family) retain at higher rates (50–60%).
How to use it: Encourage your supporters to create their own fundraising pages for your cause, then thank both them and their networks separately.
Start with recurring giving + personalized thank-yous + P2P—and layer in more tools as you grow.
Most nonprofits chase new donors like it’s a sprint
But what about DRR? That’s your marathon strategy. It’s how you build endurance, grow revenue, and stop bleeding dollars from the donor bucket. So go check your DRR stats.
Seriously—open that CRM, run the report, and see who’s sticking with you. Then ask yourself: How can I make staying feel as good as giving did?
Common Donor Retention Rate questions answered
If your Donor Retention Rate (DRR) is sitting below 35%, something’s off. But don’t stress—it’s fixable. Here’s what might be dragging it down:
What’s going wrong?
- Weak stewardship: Delayed or one-size-fits-all thank-yous. No “here’s the impact you made.”
- Weak first impressions: First-time donors give… and then hear crickets.
- Tough economy: People are tightening their wallets, especially small-dollar donors.
- Using the wrong channels can cost you—donors from digital ads don’t stick (just 20–30% DRR). But Event donors? They’re the loyal crew, holding strong at 50–60%. Quick wins to turn it around.
- Send a thank-you email within 48 hours—make it warm, specific, and personal.
- Roll out a welcome series for first-time donors (3–5 messages max, packed with impact).
- Lean into monthly giving—it’s got serious staying power. We’re talking 80–90% donor retention.
- Share updates regularly (newsletters, social, behind-the-scenes peeks).
- Lost some folks? Ask why. A short donor survey can reveal gold.
Big difference. First-timers are curious. Repeat donors? They’re loyal.
- First-time donors: Average retention is 19–29%. Many give once—during a campaign or through a friend—and bounce.
- Repeat donors: Way more likely to stick. Average retention sits between 58–63%.
What You Can Do:
- For first timers: Roll out the red carpet. Welcome emails, impact stories, maybe a “why your gift matters” video. Target 25–30% retention.
- For repeat donors: Keep it personal. Name-drop their last gift. Celebrate milestones. Show them they matter. Goal: 60–70%.
Short answer? At least once a year. That’s your baseline. It lines up with typical fundraising cycles and gives you a big picture.
Want to level up? Go more frequently:
- Quarterly check-ins: Great for spotting trends in specific groups—like first-time donors from a big campaign.
- Monthly tracking: Best for busy shops with recurring donors or tons of activity. You’ll catch red flags early.
Pro Tip: Use your CRM’s retention report feature or set up a spreadsheet to do it manually. The point is simple: track regularly so you can test, tweak, and win.
Let’s talk gear. You’ve got options—from plug-and-play to DIY:
- CRMs: DonorPerfect, Salesforce NPSP, and NeonCRM all have DRR reports built right in.
- Spreadsheets: Still powerful. Excel or Google Sheets with VLOOKUP can show who gave when.
- Dashboards: Tools like Tableau, Power BI, or Google Data Studio make your trends visual and easy to act on.
- Predictive Tools: Want to get fancy? Use Dataro or Fundraising KIT to spot donors who might bail—before they do.
- Feedback Tools: Use SurveyMonkey or Google Forms to ask lapsed donors, “What happened?” Their answers can guide your next move.
Retention is cheaper than acquisition—by a lot.
- Getting a new donor? That could cost you $50 to $100 (think digital ads, Events, mailers).
- Keeping a donor you already have? Way easier—and just $5 to $10 (thank-you notes, emails, maybe a phone call).
Why it matters: Every percentage you boost DRR means more predictable revenue and fewer dollars spent chasing new donors.
These work:
- Say thanks fast. Personal touches matter.
- Welcome them in: For first-time donors, roll out a 3–5 email welcome series. Show the impact. Share the mission. Make it personal.
- Promote monthly giving: These folks stick around 80–90% of the time. Add the option on every donation form. Mention it in your follow-ups.
- Keep the impact coming: Newsletters, videos, stories—donors want to know their gift did something. Show them.
- Ask for feedback: Quick surveys can uncover why some folks leave—and how to keep others.
- Re-engage lapsed donors: Send a “We miss you” message. Sweeten it with a matching gift or recent success story.
You need a goal that matches your starting point and your capacity. Here’s how to think about it:
- Low DRR (under 35%)? You’ve got a big room to grow. Aim to jump 5–10% in 1–2 years. (Example: 30% to 35%.)
- Mid-range DRR (35–45%)? You’re near the industry average. Push for 3–5% growth. (Say, 40% to 44–45%.)
- High DRR (45–50%+)? Nice work! Now focus on fine-tuning. A 1–3% gain—or even just holding strong—is a win.
Zoom in by segment:
- First-time donors: Go for a 5–10% bump (e.g., 20% → 25–30%).
- Repeat donors: Shoot for 2–5% (e.g., 60% → 62–65%).
- Major or recurring donors: Maintain that 70–90%. You’ve earned it—now protect it.
Great question—it shifts a lot depending on how donors first come in. Here’s the quick breakdown:
- Events / Peer-to-Peer: 50–60% DRR. People give because they care personally. They’re in it with you.
- Direct Mail: 40–50%. These appeals are targeted, but some donors just give once and dip.
- Online / Digital Ads: 20–30%. Lots of impulse givers here. Loyalty? Not so much.
- Recurring Giving Programs: 70–90%. The gold standard. Automated giving = sticky donors.
Pro tip: Want to raise your DRR? Double down on high-retention channels (like Events), and fix leaky ones (like digital) with better onboarding.
Absolutely. Funders love to see high retention. It tells them you’ve built trust, have loyal supporters, and you’re sustainable.
A solid DRR is like a stamp of credibility. Many grant applications even ask for it directly.
When the economy tanks—think inflation, recession—DRR tends to dip. Donors tighten their wallets, especially smaller ones giving under $500.
What can you do about it?
- Let folks pause monthly gifts when needed.
- Offer ways to stay involved that don’t cost money—like volunteering.
- Focus energy on recurring and major donors—they’re steadier (hello, 70–90% DRR).
Smart pivot: One nonprofit stayed steady at 40% DRR during tough times by promoting $5/month options and leaning on major donors.
Recurring giving is your DRR hero. While average DRR might hover around 35–45%, recurring donors stay loyal—really loyal—with 70–90% retention.
Why? Monthly giving feels automatic. It’s easy for donors and keeps them emotionally invested in your mission.
Bottom line: Want to grow your DRR? Make recurring giving front and center.
If you enjoyed this article, you might also like:
- 42 Fundraising KPIs and Metrics Everyone Should Measure
- Calculating the return on investment (ROI) in fundraising
- What is the Gifts Secured Metric in fundraising? How to calculate and use GSM
- What is the conversion rate? How to calculate and use conversion rate
- What is Pledge Fulfillment Percentage in fundraising? How to calculate and use PFP?