
Calculating the return on investment (ROI) in fundraising
In this article
- What is the return on investment (ROI) in fundraising?
- When should you calculate fundraising ROI?
- What are the limits of fundraising ROI?
- How to calculate your fundraising ROI
- How to track your fundraising return on investment
- Tips for accurate calculation of return on investment
- How can you improve your campaign ROI?
- What are the primary drivers of ROI growth?
- How can you use RallyUp to easily track your ROI?
- How to benchmark your ROI growth
- Industry benchmarks for ROI growth
- What is a good return on investment in fundraising?
- How Fort Collins Top Dog maximized their return on investment with RallyUp
- How St. Francis de Sales School maximized their return on investment with RallyUp
- Start tracking return on investment (ROI) with RallyUp
- Common ROI questions for nonprofit fundraising – answered
This is your ultimate guide to fundraising ROI!
We’re talking about how to calculate it, how to boost it, and how to know when you need more info to make those big, bold, strategic moves.
What is the return on investment (ROI) in fundraising?
Alright, let’s talk about fundraising ROI—your resource for crushing it in the fundraising game! This isn’t just some boring metric. And guess what? It’s super simple to figure out. Let’s break it down, step by step, so you can own this like a pro.
Fundraising ROI is all about comparing what you spent to what you earned. Think of it as your fundraising report card. Did you ace it? Or is there room to level up?
Sure, gross revenue numbers might look flashy, but ROI is the real “most valuable player” when it comes to measuring your campaign’s success. Why? Because it’s not just the money you raise—it’s the money you keep after costs. And hey, if you’re not tracking ROI, you’re basically flying blind.
Until you factor in the costs of your fundraising efforts and think about where else that money could’ve gone, you can’t really say if your campaign crushed it or just… fizzled.
Now, some folks think ROI is just a “business thing” that doesn’t apply to nonprofits. Wrong! Others say they care about ROI, but then they keep doing the same old underperforming events or mailing letters to people who’ll never donate. C’mon, we can do better than that!
Your nonprofit probably doesn’t have endless time, money, or resources. Nope, it’s a zero-sum game. Add one activity? You’ve gotta drop another. That’s why squeezing every drop of ROI out of your fundraising is non-negotiable.
So, ready to level up? Let’s see how to make every dollar, every hour, and every effort count. Your mission (and your ROI) deserves nothing less.
When should you calculate fundraising ROI?
When should you consider calculating your fundraising ROI? Here are our recommendations:
- After a fundraising event: See how it performed!
- Before planning your next event: Estimate how cost-effective it’ll be.
- To compare campaigns: Find out which ones crushed it, and which ones need re-working.
- For strategic budgeting: Plan smarter for future fundraising efforts.
What are the limits of fundraising ROI?
No single metric can tell you everything about your fundraising program’s success (or where it’s falling short). For example, campaign ROI is awesome, but it doesn’t account for the lifetime value of your donors. And guess what? That’s a huge deal when you’re making big, strategic investment decisions.
Here’s another thing: not all campaigns are created equal. If you’re running a campaign to re-engage lapsed donors or attract brand-new supporters, your ROI will look totally different than, say, a major donor push. And that’s okay! Different goals = different results.
The bottom line? Don’t put all your eggs in one metric basket. Instead, use a mix of fundraising metrics to get the full picture. Think of it like this: ROI is a key piece of the puzzle, but it’s not the whole puzzle.
So, what’s the takeaway? Broaden your perspective! Use multiple metrics to measure performance.
How to calculate your fundraising ROI
You calculate ROI for each fundraising tactic. So, if your ROI is 100%, that means you doubled your money—cha-ching! For every $1 you spent, you raised $2. Not bad, right?
- Total costs: Add up everything you spent on the campaign. Printing, postage, event costs, staff time—you name it. Every penny counts!
- Total revenue: This is the grand total of all the funds you raised.
- Net revenue: Subtract your total costs from your total revenue. This is your profit.
- ROI: Divide your net revenue by your total costs. Boom! That’s your ROI ratio. Want it as a percentage? Multiply by 100. Easy!
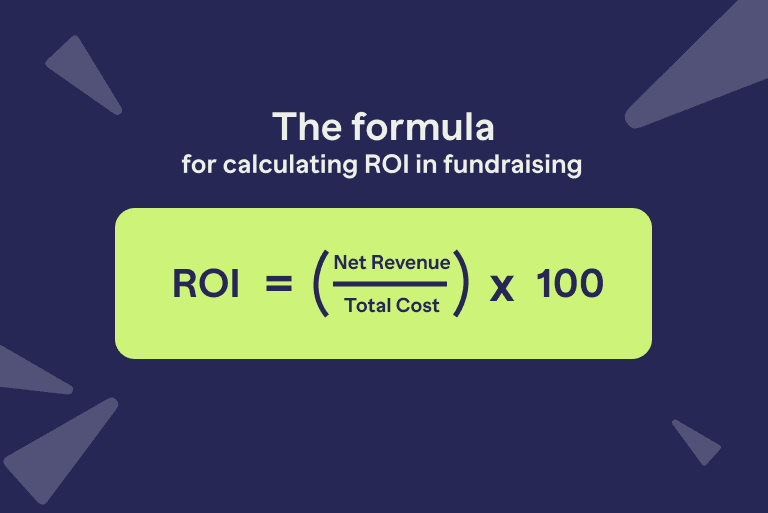
The formula for calculating ROI in fundraising
In math-speak, it looks like this:
ROI = (Net Revenue / Total Costs) x 100
And there you have it! Fundraising ROI isn’t just a number—it’s your roadmap to smarter, stronger, and more successful fundraising. So, what are you waiting for?
Go calculate that ROI and start making every dollar work harder for your mission.
Fundraising ROI example using the ROI formula
Picture this: you launch a fundraising campaign that pulls in $300,000 in donations. Awesome, right? But —you spent $30,000 to make it happen. Let’s do the math and see how it stacks up!
Fundraising ROI = ($300,000 – $30,000) / $30,000 = 9
Bam! That means for every $1 you invested, you earned $9. NINE TIMES YOUR MONEY! That’s not just a win—that’s legendary.
But hold up—fundraising ROI isn’t just about the numbers. Nope, it’s your power to make smart, strategic moves. Every dollar matters, especially when you’re fundraising for a cause you’re passionate about. Knowing your ROI helps you figure out what’s crushing it, what’s falling flat, and where to double down next. It’s like having a cheat code for your fundraising strategy—no more guesswork!
Now, let’s talk about people power.
Want to know how much it costs to have an employee work on a specific project? Here’s a quick trick: take their total yearly compensation (salary + benefits) and divide it by 2,000. That gives you a ballpark hourly rate.
For example, let’s say Jake makes $80,000 a year (salary + benefits). Divide that by 2,000, and you’re paying him roughly $40/hour. If he spends 25 hours working on your charity auction, that’s $1,000 of Jake’s time invested in that event.
See how this works? It’s all about being smart with your resources—time, money, and people. When you know your ROI and your costs, you can make every dollar and every hour count.
So, start calculating, start strategizing, and start smashing those fundraising ends! You’ve got the tools!
How to track your fundraising return on investment
Here are the steps you need to consider when tracking your ROI.
1. Define clear revenue sources
What to include:
 Direct donations (online, cash, checks)
 - In-kind gifts (monetized)
- Sponsorships, ticket sales, auctions
- Matching gifts, fulfilled pledges
- Align time frame: Exclude unrelated or future pledges unless attributable
- Track by channel: Use CRM to track email, social media, direct mail, etc.
2. Account for all costs
What to include:
 Direct costs: Marketing, Events, Software, Staff
 - Indirect costs: Pro-rated salaries, Rent, Volunteer support
- Hidden costs: Postage, Travel, Processing Fees (2–3%)
Track related indicators like:
- Cost per Dollar Raised (CPDR): Cost ÷ Revenue (e.g., $0.25 per $1 raised).
- Donor Acquisition Cost: Cost of acquiring new donors ÷ Number of new donors.
- Donor Retention Rate: Impacts long-term ROI by reducing acquisition costs.
3. Segment for granular insights
 By Campaign/Channel: Email vs. Events vs. Direct Mail
 - By Donor Type: Major vs. recurring vs. small donors
- By Time: Compare ROI quarterly or annually
4. Leverage technology
Here are some tools that can help you understand the numbers:
 CRM: Salesforce, DonorPerfect, Kindful, Blackbaud
- Analytics: Google Analytics, Social Media Insights
- Expense Tools: QuickBooks, Expensify
- Reporting Tools: Tableau, Power BI, Google Data Studio
- Attribution: Implement tracking codes (e.g., UTM parameters) and CRM rules to accurately link donations to campaigns.
5. Factor in time horizons
Short-Term ROI: One-time events
Long-Term ROI: Donor lifetime value, planned giving
| Category | Details |
|---|---|
| Setup | Campaign: Year-end email and social media drive |
| Tools Used | Mailchimp (email), Meta Ads (social), CRM, QuickBooks (expenses) |
| Data Collection | Revenue: $25,000 from 500 donors (tracked via UTM-tagged donation forms) Costs: $4,000 (Email: $500, Ads: $1,500, Staff: $2,000) |
| Calculations | Net Revenue: $25,000 – $4,000 = $21,000 ROI: $21,000 / $4,000 × 100 = 525% (5.25:1) |
| Channel ROI | Email: 6:1 (higher ROI due to low cost) Social Ads: 3:1 (lower ROI due to higher ad spend) |
| Benchmark | Industry average for email campaigns is 4:1 → This campaign outperforms |
| Next Actions | Increase email budget by 20% next year Test new ad creatives to improve social ROI |
Tips for accurate calculation of return on investment
Step 1: Comparing ROI
Imagine your nonprofit is crushing it with these ROIs:
- 400% ROI on your online crowdfunding campaign—hello, internet magic!
- 150% ROI on your monthly giving program—steady and strong!
- 60% ROI on your charity 5K run—get those sneakers moving!
- 20% ROI on your email campaigns—hey, every bit counts!
(Psst… these are just examples. Your numbers will be unique to your nonprofit. But you get the idea!)
Just because one strategy has a lower ROI than another doesn’t mean you should ditch it. Nope! Every tactic plays a role in your fundraising ecosystem. It’s like a team—every player matters.
Now, let’s talk about calculating costs.
You could go all-in and factor in indirect costs like office rent, electricity, and website maintenance… but honestly? That’s overkill.
Instead, keep it simple and focus on direct campaign costs. Think:
- Print and postage for that direct mail campaign
- All event costs for your fundraising gathering
- Creative and design costs for your campaign visuals
- Advertising and promo costs to spread the word
- Staff time spent on the campaign (estimate this—it’s important!)
Boom! That’s it. No need to overcomplicate things. By focusing on these direct costs, you’ll get a clear picture of your ROI without losing your mind.
Step 2: Calculate your campaign’s return
If you’re not tracking where your donations are coming from, you’re missing out on key insights. So, tag every gift to a specific source—no excuses!
Now, let’s see how this works. Ready? Let’s roll!
 Example 1
Amount Raised: $450,000
Amount Spent: $180,000
Here’s the math: [450,000 – 180,000) / 180,000] x 100 = 150%
This campaign crushed it with a 150% ROI. That means for every $1 spent, you earned $2.50. Talk about winning! High fives all around.
Example 2
Amount Raised: $90,000
Amount Spent: $90,000
Here’s the math: [(90,000 – 90,000) / 90,000] x 100 = 0%
Okay, so this campaign broke even. Not a loss, but not a win either. It’s a 0% ROI—basically, you got your money back but didn’t gain anything extra. Time to rethink and refine!
Example 3
Amount Raised: $50,000
Amount Spent: $75,000
Here’s the math: [(50,000 – 75,000) / 75,000] x 100 = -33.3%
Ouch. This campaign lost money upfront, with a -33% ROI. But there is the silver lining: tracking ROI helps you catch these underperformers early. Now, you can figure out what went wrong, adjust your strategy, and come back stronger next time.
Example 4
Imagine your fundraising event had the following data:
- Donations: $15,000
- Sponsorships: $25,000
- Ticket sales: $18,000
- Marketing costs: $6,000
- Event costs: $12,000
- Staff costs: $8,000
- Technology costs: $4,000
You can calculate your fundraising ROI as follows:
- Total funds raised = 15,000 + 25,000 + 18,000 = $58,000
- Fundraising costs = 6,000 + 12,000 + 8,000 + 4,000 = $30,000
- Fundraising ROI = (58,000 – 30,000) / 30,000 × 100
- Fundraising ROI = 93.3%
In this case, your fundraising ROI is 93.3%, meaning for every $1 spent, you raised approximately $0.93.
The takeaway? Tracking ROI is your source for smarter fundraising. Whether you’re celebrating a 150% win, breaking even, or learning from a -33% loss, every number counts. And that helps you fundraise with more focus and more impact.
How can you improve your campaign ROI?
If boosting your ROI is the goal—and let’s be real, it should be—here’s the plan: spend less, earn more. Sounds simple, right? But how do you make it happen?
Traditionally, nonprofits use donor segmentation—grouping donors based on things like demographics or past giving. It’s a solid start, but broad assumptions aren’t as powerful as real predictions. You need precision, not guesswork.
In this regard, technology is your new best friend. With AI-driven predictive modeling, you can pinpoint exactly who’s most likely to respond to your campaign.
No more “spray and pray” method. Just laser-focused outreach that actually works.
Still not convinced? Check out these real-world wins:
Greenpeace boosted its ROI by 22.8% in a direct mail appeal using Dataro’s predictive scoring. The campaign also saw a 12.7% increase in net revenue and a higher response rate compared to traditional RFM (Recency, Frequency, Monetary) methods.
Strategy: Dataro used machine learning to analyze donor behavior and predict who was most likely to give.
Result: Greenpeace retained 64 additional donors in one month through a proactive “Thank You” calling program, resulting in an estimated $23,040 in additional revenue and a 2.13 ROI.
Outcome: Dataro’s churn propensity scores identified donors at risk of stopping their regular gifts. Greenpeace then engaged these donors with personalized calls, significantly reducing churn rates.
Parkinson’s UK increased net revenue by 23% and raised an additional £15,000 in their September Appeal using Dataro’s AI predictions. They also received 411 extra gifts that would have been missed with traditional methods.
Strategy: By using predictive scores, Parkinson’s UK reduced mailing volumes while increasing donor engagement. The AI model identified donors most likely to give, resulting in a higher response rate and improved ROI.
Victor Chang Cardiac Research Institute crushed it with a 319% ROI on a donor retention drive powered by AI.
Strategy: By using predictive modeling, the institute identified donors at risk of lapsing and implemented targeted retention strategies.
WaterAid’s “Talk to Sellu” chatbot campaign raised £8.2 million, with 76% of donations made after just one visit to their website.
Strategy: The chatbot allowed potential donors to explore how their contributions would impact a village in Sierra Leone, creating an engaging and interactive donor experience.
See the pattern? AI isn’t just a buzzword. By focusing on the right people with the right message, you can supercharge your fundraising and make every dollar count.
What are the primary drivers of ROI growth?
- Cost efficiency: Cut unnecessary costs and streamline operations. Go hybrid or virtual! Every dollar saved boosts ROI!
- Donor retention: Keep your donors happy! It’s cheaper to retain them than to find new ones.
- Diversified channels: Don’t put all your eggs in one basket. Mix it up! Major gifts, digital campaigns, grants, and events create a balanced, resilient strategy.
- Tech & Automation: Use tools like CRM systems and AI-driven analytics to work smarter, not harder.
- Test and iterate: Run A/B tests on campaigns (e.g., subject lines, donation asks) to identify what maximizes revenue.
- Optimize low-cost channels: Focus on email, social media, or peer-to-peer fundraising, which typically have lower costs and scalable returns.
- Invest in major donors: Allocate resources to cultivate high-net-worth donors, as they often provide outsized returns.
- Figure out what works best. Analyze campaign performance: peer-to-peer? Corporate sponsorships? Focus on the winners!
How can you use RallyUp to easily track your ROI?

RallyUp offers a suite of tools designed to help organizations track and enhance their return on investment (ROI) in fundraising efforts.
Key features include:
- Donor management: Centralize donor information, monitor interactions, and automate outreach to maintain engagement.
- Integrations: Connect with platforms like Google Analytics and Meta Pixel to analyze donor behavior and optimize marketing strategies.
- Email Marketing Automation: Utilize built-in tools to send targeted messages, enhancing donor relationships and retention.
- Comprehensive Fundraising Solutions: Access various fundraising activities such as raffles, auctions, and crowdfunding, all within a single platform.
These features enable organizations to effectively monitor performance, streamline operations, and maximize fundraising ROI.
1. Set up your fundraising campaign
- Choose from RallyUp’s 10+ fundraising activities, such as raffles, auctions, crowdfunding, or peer-to-peer campaigns. Each activity is customizable and comes with built-in ROI tracking tools.
- Use Instant Fundraiser Templates to quickly launch campaigns tailored to your goals. These templates are designed by fundraising experts to help maximize ROI.
2. Monitor revenue in real time
- RallyUp’s live dashboard shows you how much money you’re raising as donations come in. This includes breakdowns by campaign type, donor type, and geographic location.
- Example: For a crowdfunding campaign, you can see how much each donor contributed and which incentives (like tiered donations) drove the most revenue.
3. Calculate net revenue
- Subtract your total costs from your total revenue using RallyUp’s built-in financial tracking tools. The platform automatically generates a net revenue figure for each campaign.
4. Analyze campaign performance
- RallyUp’s analytics dashboard provides insights into which campaigns performed best. You can compare ROI across different activities (e.g., raffles vs. auctions) and identify trends.
How to benchmark your ROI growth

ROI benchmarks aren’t exactly thrilling. But knowing them? Turning point! Whether you’re a startup nonprofit or a well-oiled fundraising machine, these numbers help you track wins, fix flops, and grow smarter.
1. The ROI scoreboard
The Big Picture: Most nonprofits pull in $4 for every $1 spent—nice! But dig deeper, and things get spicy:
Nonprofit Fundraising ROI at a glance:
| Fundraising Method | ROI Range | Insight |
|---|---|---|
| Direct Mail (The Trusty Workhorse) | 0.5:1 to 1:1 | “Yes, printing costs sting. But for loyal donors? Worth every stamp.” |
| Email Campaigns (Impact Player) | 2:1 to 5:1 | “Cheap, scalable, and sneaky-effective—if your subject lines don’t scream ‘spam.'” |
| Major Gifts (The Heavy Hitter) | 10:1 or higher | “Big donors = big returns. Pro tip: Don’t ghost them after the first check.” |
| Events (The Wild Card) | 2:1 to 3:1 | “Galas can glitter, but ROI hinges on ticket prices and open-bar diplomacy.” |
| Grants (The High-Effort Jackpot) | 5:1 to 20:1 | “Applications are a grind, but the payoff? Chef’s kiss.” |
 Sector secrets
Human services: Often 2:1 to 3:1 (Small donors = big heart, slim margins)
Higher Ed/Healthcare: 5:1 to 10:1 (Thanks to alumni and deep-pocketed benefactors)
2. Benchmark (no spreadsheet phobia required)
| Insight | Details |
|---|---|
| History Lessons | If your gala achieved a 2.5:1 ROI last year, use that as a baseline—aim to beat it this year. |
| Friendly Competition | Use FEP (Fundraising Effectiveness Project) or AFP (Association of Fundraising Professionals) reports to compare peer performance. It’s not snooping—it’s smart strategy. |
| Baby Steps Count | Got a 3:1 ROI on email? Push it to 3.5:1 with sharper segmentation or stronger storytelling. |
3. ROI boosters
 Retention = Free Money
A 10% boost in donor retention can mean 50% more revenue long-term. Translation: Treat your donors like VIPs.
Cut costs, not corners
Ditch pricey mailers for digital? Negotiate with vendors? YES! Right donor, right ask: Stop blasting everyone. High-value donors deserve red-carpet treatment.
Tech isn’t evil
A good CRM (cough Salesforce cough) costs upfront but pays off in sanity and scalability.
Industry benchmarks for ROI growth
Sustainable growth: Aim for a 5% to 15% increase in ROI per year. That’s healthy and achievable!
High-Growth nonprofits: Some NPOs hit 20%+ ROI growth by embracing innovation—think digital transformation, donor retention programs, and more.
Example benchmarking scenario
A mid-sized nonprofit with a $1M annual budget runs a year-end giving campaign:
- Year 1: Spends $20,000 (marketing, staff time, software) and raises $80,000. ROI = ($80,000 – $20,000) / $20,000 = 3:1.
- Benchmark Analysis: Industry average for similar campaigns is 4:1. Peer nonprofits with similar budgets achieve 3.5:1.
- Growth Plan: Improve donor segmentation and reduce printing costs by 10%. Goal: 3.5:1 ROI in Year 2.
- Year 2: Spends $18,000, raises $88,000. ROI = ($88,000 – $18,000) / $18,000 ≈ 3.89:1, exceeding the goal.
What is a good return on investment in fundraising?
- 5:1+ – Killing it! Seen in major gifts and grants.
- 3:1 to 5:1 – Solid return! Common for direct mail & sponsorships.
- 2:1 to 3:1 – Decent, but room to grow. Typical for online giving & peer-to-peer.
- Below 2:1 – Red flag! High costs may be eating into your funds.
Industry averages: How does your ROI compare?
- Direct mail: 3:1 to 5:1 (Every $1 spent raises $3–$5)
- Online giving: 2:1 to 3:1 (Lower cost, but also lower return)
- Major gifts: 10:1+ (Biggest bang for your buck!)
- Fundraising events: 2:1 to 3:1 (Great for engagement, but costs add up)
- Corporate sponsorships: 4:1 to 5:1 (Strong partnerships = strong returns)
- Peer-to-Peer fundraising: 3:1 to 5:1 (Low cost, high engagement!)
💡 What’s the takeaway? These are averages—your actual ROI depends on your size, mission, and strategy. Instead of chasing generic benchmarks, set your own ROI goals and keep optimizing!
How Fort Collins Top Dog maximized their return on investment with RallyUp
Case Study
Snapshot
Top Dog fundraiser sparks 90% donation growth with RallyUp!
- Top Dog is an annual fundraiser where donors decide who the top dog in Fort Collins is!
- In this adorable Crowdfunding campaign, each pup got its own fundraising page and every dollar donated counted as one vote for the pup.
- Odell Brewing sponsored Top Dog, with proceeds going to the Northern Colorado Wildlife Center.
- Peer-to-Peer, live rankings, comments, and cute pups on display ignited friendly competition.
- The event moved to RallyUp this year and raised almost double that of last year.
“We will definitely be coming back to RallyUp for the Top Dog fundraiser next year! After having an absolutely awful experience with two previous platforms, this has been a breath of fresh air. I’m excited to continue growing this event and want RallyUp to be our forever platform!”
Fort Collins Top Dog Founder
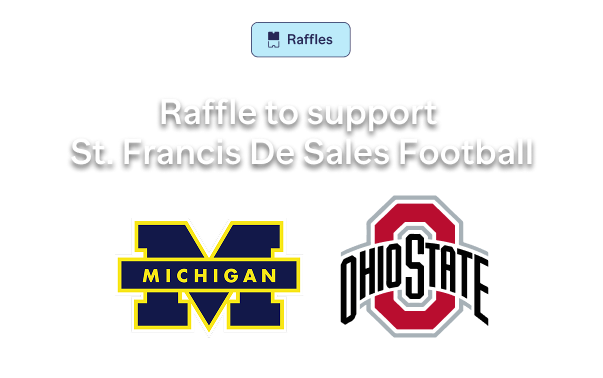
How St. Francis de Sales School maximized their return on investment with RallyUp
Case Study
Snapshot
The St. Francis de Sales School raised over 40% more funds in a ¼ of the time with RallyUp Raffles
- The St. Francis de Sales School ran two Raffles to raise funds for student scholarships and their school football program.
- Every donation stood a chance to win tickets to the historical 119th UM vs. OSU Football Game.
- They powered up student fundraising with RallyUp’s Peer-to-Peer by giving out prizes to daily leaders and ranking classrooms by ticket sales.
- With RallyUp they only had to fundraise for 9 days, versus their previous 6 weeks, and raised over 40% more!
“RallyUp’s user interface is stellar, the live chat and backend management are unparalleled. The RallyUp platform instilled a lot of confidence in our users and donors. When we discovered RallyUp, we thought, okay, this is what we have been looking for!”
President, St. Francis de Sales School
Start tracking return on investment (ROI) with RallyUp
Raise more, spend less with RallyUp!
💡Run your event on RallyUp. RallyUp is a digital fundraising platform designed to help organizations maximize fundraising efficiency while minimizing event costs. RallyUp’s payment system is designed to benefit the organization’s needs and help maximize their ROI.
Organizations can choose from flexible payment plans – “Free” with donor tipping or “Flex” with no donor tipping, and even “Custom Pricing” plans.
That means, the organization can choose the pricing model that best suits their ROI, with no upfront costs and the option to fundraise for free!

Worried your event won’t be profitable? Go Peer-to-Peer!
💡Instead of stressing over event costs, switch to a RallyUp Peer-to-Peer fundraiser. You’ll raise more with less effort, thanks to smart automation, real-time tracking, and easy donor engagement.
Example:
Set a fundraising goal of $75,000, and your total cost is just 3% ($2,250). That means you keep $72,750—a 3,133% ROI!
Or, if you go bigger…
Raise $100,000 with RallyUp, and your total cost is only $3,000 (3%). You walk away with $97,000—a 3,133% ROI!
Now compare that to:
Direct mail: -28% ROI (yes, negative!)
Grants: RallyUp gives you 8X the return
Traditional events: RallyUp outperforms by 32X
Most fundraising platforms are clunky, complex, and expensive. RallyUp makes it fast, easy, and effective.
✔ One place for everything: Run events, track donors, and get instant reports—without pulling endless spreadsheets.
✔ Less wasted effort: No more sinking time into fundraisers that don’t work.
✔ More money for your mission: Lower costs, higher results—simple math.
Want to make more at your next event? Use RallyUp and boost your ROI today!
Common ROI questions for nonprofit fundraising – answered

A strong ROI is typically 5:1 or higher (raising $5+ for every $1 spent).
3:1 to 5:1 is solid, while below 2:1 may indicate inefficiencies.
Major gifts (10:1+) and grants (5:1 to 10:1) offer the highest returns.
Corporate sponsorships (4:1 to 5:1) and peer-to-peer (3:1 to 5:1) also perform well.
Events come with high costs (venues, catering, staffing, etc.), leading to an average ROI of 2:1 to 3:1. They’re great for engagement, but not always the best for maximizing revenue.
Low fundraising ratio = higher ROI (you’re raising more with lower costs).
High fundraising ratio = lower ROI (expenses are eating into revenue).
Focus on low-cost, high-return strategies (major gifts, grants, peer-to-peer).
Automate donor engagement to reduce labor costs.
Optimize digital fundraising and reduce event overheads.
Fundraising method, donor engagement and technology use.
Yes! Industry averages are helpful, but your goals should align with your size, mission, and strategy.
Not always! Some campaigns prioritize awareness and engagement over immediate financial returns.
If you enjoyed this article, you might also like:
- How nonprofits maximized their conversion rate with RallyUp
- Nonprofit ratios: considering your fundraising efficiency
- Calculating your cost-per-dollar raised: a guide for nonprofits
- Cost-effectiveness in Fundraising: How to do a Cost-Benefit Analysis and Why it’s Important
- What is the Gifts Secured Metric? How to calculate and use GSM