What is Pledge Fulfillment Percentage in fundraising? How to calculate and use PFP?
In this article
- What is Pledge Fulfillment Percentage (PFP) in fundraising?
- Calculating Pledge Fulfillment Percentage (PFP)
- Importance of measuring Pledge Fulfillment Percentage in fundraising
- Tracking Pledge Fulfillment Percentage
- Tips for the accurate calculation of Pledge Fulfillment Percentage
- Need a setup guide? We are happy to help!
- What is a good Pledge Fulfillment Percentage in fundraising?
- Metrics matter, but donors matter more.
- Common Pledge Fulfillment Percentage questions answered
Numbers are powerful—but wow, can they spiral out of control fast! Sure, tracking what works (and what flops) is a must, but who has time to juggle a zillion data points? We know most nonprofit leaders have enough going on.
That’s why we encourage you not to track everything right away. Start small—pick one or two metrics and crush them. Then level up when you’re ready.
Up first? The Pledge Fulfillment Percentage—we’ll unpack it with simple formulas, real examples, and a big reminder you won’t want to miss.
What is Pledge Fulfillment Percentage (PFP) in fundraising?
Pledge fundraising
Pledges are commitments donors make to give your nonprofit money (or goods/services) over a set period of time. Unlike one-time donations, pledges are promises to pay later—like when a donor commits to giving $5,000 over nine months instead of all at once. Donations, on the other hand, are paid immediately.
But not all pledges turn into real cash. That’s where Pledge Fulfillment Percentage (PFP) comes in! It shows you how many promises actually come through.
Donations vs. Pledges: finding the right balance
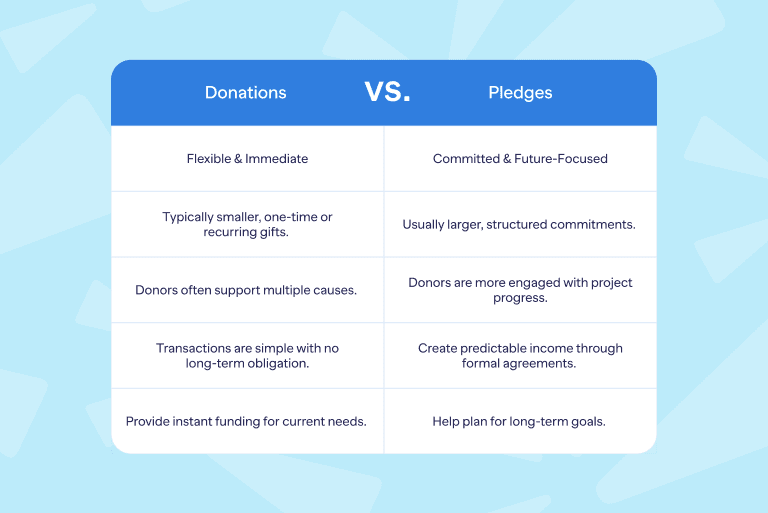
Both donations and pledges play important—but different—roles in nonprofit funding. Here’s how they compare:
Donations: Flexible & Immediate
- Typically smaller, one-time or recurring gifts.
- Donors often support multiple causes.
- Transactions are simple with no long-term obligation.
- Provide instant funding for current needs.
Pledges: Committed & Future-Focused
- Usually larger, structured commitments.
- Donors are more engaged with project progress.
- Create predictable income through formal agreements.
- Help plan for long-term goals.
Why do you need both?
Donations keep operations running today while pledges secure stability for tomorrow. Smart nonprofits balance:
✅ Immediate needs (covered by donations);
✅ Future projects (supported by pledges).
The best approach? A diversified funding strategy that welcomes all levels of support.
Pledges vs. Recurring Donations: What’s the difference?
| Pledge | Recurring donation |
|---|---|
| A promise to pay a fixed amount over a set period (e.g., $2,400 over 4 years at $50/month) | Open-ended gifts with no end date (e.g., $50/month indefinitely). |
| Can be conditional (paid only if a goal is met) or unconditional (no strings attached). | A donor can cancel anytime. |
| Legally binding in some cases (check your policies!). | Flexible for donors. |
| Predictable cash flow for planning. | Less predictable long term. |
Which should you prioritize?
Pledges = Best for capital campaigns or projects needing guaranteed funding.
Recurring Gifts = Ideal for sustainer programs (e.g., monthly donors).
👉Pro tips:
- For big projects, ask for pledges (with clear terms).
- For ongoing needs, cultivate recurring donors.
Pledge Fulfillment Percentage in fundraising
Pledge Fulfillment Percentage is tracking and collecting pledged funds to ensure your nonprofit actually receives what was promised. Since many organizations count pledges as expected revenue in their budgets, unfulfilled pledges can create financial gaps.
Why does it matter?
- Budget reliability – If pledges don’t come in as expected, you might end up short.
- Donor trust – Following up on pledges helps maintain strong donor relationships.
- Cash flow – Tracking fulfillment ensures you know when funds will arrive.
Next, we’ll look at how to measure and improve pledge fulfillment—so you can plan with confidence!
Future promise or immediate impact
Pledges come in two main forms, each with its own benefits:
1. Unconditional pledges
- A straightforward commitment to give a set amount by a specific date.
- Example: $8,000 to be paid in four equal quarterly installments.
2. Conditional pledges
- Contributions that depend on certain events or milestones being met.
- Example: $45,000 pledged after a building project is completed.
Why do pledges work well?
- Allow donors to spread payments over time.
- Offer flexible scheduling (monthly, quarterly, etc.).
- Have a clear end date, unlike open-ended recurring donations.
- Can increase donors’ capacity to give.
👉Many donors begin with one-time gifts but transition to pledging as they become more engaged with your cause.
Calculating Pledge Fulfillment Percentage (PFP)
Pledge Fulfillment Percentage (PFP) tells you what % of pledged money actually came in—so you can measure success and spot issues.
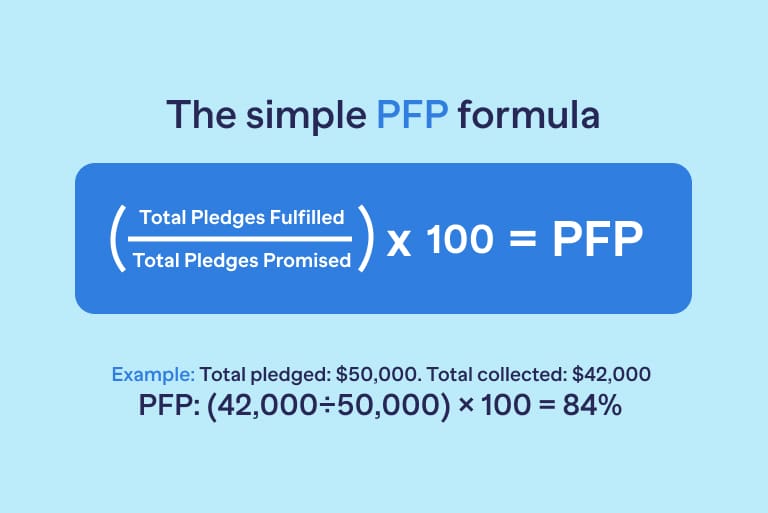
Example:
Total pledged: $50,000
Total collected: $42,000
PFP: (42,000÷50,000) × 100 = 84%
To optimize your fundraising, track both:
- Percentage of donors honoring pledges – Are most supporters following through?
- Percentage of dollars collected – Are you capturing the full pledged amount?
This way you’ll:
- Identify which donors need gentle reminders.
- Reveal if certain pledge types (e.g., conditional) underperform.
- Guide personalized follow-ups to increase fulfillment.
💡Pro tips for accuracy:
- Track by timeframe (e.g., annual campaigns vs. multi-year pledges).
- Segment donors (e.g., first-time vs. repeat pledgers—loyal donors often fulfill at higher rates!).
- Compare to industry benchmarks (84% average for events, but varies by cause/donor type).
- Deploy your info into handy templates.
Importance of measuring Pledge Fulfillment Percentage in fundraising
Why tracking pledge fulfillment matters
1. Performance evaluation
- Estimates your campaign’s success in turning promises into payments.
- Industry standard: 80-90% fulfillment rate.
💡Pro tip: Compare your rate to benchmarks to spot improvement opportunities.
2. Financial forecasting
- Helps predict actual revenue for smarter budgeting.
- Smart practice: Assume 8-10% won’t materialize.
Example: If you have 100K in pledges, budget for 90K of actual income.
3. Donor engagement
- Flags which supporters need reminders.
- CRM systems can automate follow-ups.
- Bonus: Shows which donors are most reliable for future asks.
4. Campaign improvement
- Reveals patterns (e.g., first-time donors fulfill at lower rates).
- Lets you tweak future campaigns for better results.
- Actionable insight: Maybe first-timers need clearer pledge instructions.
A well-monitored pledge system helps you raise more while working smarter.
Strategies to improve Pledge Fulfillment Percentage
1. Leverage technology for tracking
Use CRM platforms for:
- Automated pledge tracking and reporting.
- Dashboard visualizations for real-time insights.
- Accounting software integration.
- Predictive analytics to identify at-risk pledges.
2. Offer flexible payment options
Strategy: Allow installments or extended timelines.
Benefits:
- Accommodates donor budgets.
- Increases pledge sizes.
- Improves fulfillment rates.
3. Personalize donor communication
Tactics:
- Tailored thank-you notes.
- Impact updates (e.g., “Your pledge funded 100 meals!”).
- Milestone acknowledgments.
- Example: Engagement spikes when donors see their direct impact.
4. Automate reminder systems
Approach: Schedule reminders for:
- Upcoming payments.
- Missed installments.
- Gratitude after fulfillment.
- Result: Up to 30% fewer lapses with automated workflows.
5. Educate donors
Methods:
- Explain fulfillment’s role in your mission.
- Share stories of pledge-driven outcomes.
- Provide clear terms upfront.
- Outcome: Donors become partners in sustainability.
💡Final tip: Combine these strategies for a 10–15% growth in fulfillment rates.
Planning for pledge attrition
Pledge attrition happens—but don’t worry! On average, 84% of pledges are fulfilled, meaning most donors follow through. To stay ahead, plan for a ~10% buffer in your projections.
Why do pledges sometimes fall through?
Most pledges aren’t legally binding (no penalty for backing out). And, life happens—donors forget or face unexpected financial changes.
How to minimize attrition?
📌 Set clear expectations upfront
Explain exactly what they’re pledging, when payments are due, and how it helps.
📌 Automate reminders
Send friendly payment reminders as the due date approaches.
Tracking Pledge Fulfillment Percentage
Yes, pledge fundraising takes effort – but wow, is it worth it! Unlike one-time gifts, pledges need special care: tracking payments, sending reminders, and keeping everything organized. That’s why smart fundraising platforms are your best bet!
Here’s the best part:
Pledge donors often become loyal, long-term supporters – and may even give more over time!
Treat them right (think: smooth communication and timely reminders), and your relationships will grow stronger.
💡Pro tips to stay on track:
🔹 Use your CRM – Set up automatic, friendly reminders so nothing falls through the cracks.
🔹 Keep it personal –A well-timed nudge feels helpful, not pushy.
🔹 Integrate systems – Sync payment tracking + donor management to save time and stress.
Tips for the accurate calculation of Pledge Fulfillment Percentage

1. Define pledges clearly
What counts? Only formal commitments (written agreements, online pledges, or documented verbal promises).
What doesn’t? Vague intentions (“I’ll try to give”) or non-binding discussions.
Why it matters: Ensures your pledge totals are realistic and actionable.
How to do it: Use pledge forms or CRM tools to capture:
- Donor name
- Pledge amount
- Payment schedule (e.g., “$500/month for 6 months”)
2. Use a reliable tracking system
Tools needed:
- CRMs.
Why? Manual spreadsheets lead to errors; automated systems provide real-time accuracy.
3. Reconcile pledges with payments
When? Monthly or quarterly.
How to do it? Cross-check bank deposits, payment processor reports, and CRM data.
4. Account for partial/installment payments
Donors often pay over time—tracking each installment ensures accuracy.
For example: A 1,000 pledge with 600 paid = 60% fulfillment.
How to track?
- Record each payment in your CRM.
- Calculate fulfillment as: (Total Paid ÷ Total Pledged) × 100
5. Exclude canceled/uncollectible pledges
Because including them artificially lowers your rate.
6. Use a consistent formula
Standard calculation: Fulfillment % = (Total Collected ÷ Total Pledged*) × 100
*Exclude canceled pledges.
7. Segment by campaign or donor type
Why? Fulfillment rates vary (e.g., corporate vs. individual donors).
How? Use CRM filters to analyze:
- Recurring vs. one-time pledges.
- Event-specific campaigns.
8. Set clear cut-off dates
For example: “Fulfillment % as of 12/31/2024.”
This way, you’ll avoid distorting data with late payments.
Practical example: Suppose a nonprofit campaign has:
Total pledges: $100,000 from 50 donors.
Payments received: $82,000.
Canceled pledges: $5,000 (due to donor withdrawal).
Steps for accurate calculation:
Adjust total pledged amount: $100,000 – $5,000 = $95,000.
And apply the formula: Fulfillment Percentage= (82,000 / 95,000) ×100 ≈ 86.32%
Report note: 86% fulfillment, excluding $5K canceled pledges as of [date].
Need a setup guide? We are happy to help!
Contact our support at RallyUp for free guidance and setup.
Get in Touch!
What is a good Pledge Fulfillment Percentage in fundraising?
Pledge Fulfillment Percentage (PFP) Benchmarks
Context | Reported Fulfillment Rate | Publication year |
|---|---|---|
| Event-based pledges | 85% | 2024 |
| Multi-year giving | 80-90% | 2024 |
| General fundraising | 84% | 2022 |
| General nonprofits | Below 90% common | 2020 |
Strong fundraising campaigns typically achieve pledge fulfillment rates between 80% and 90%. Here’s what you should know:
Industry standards:
- 85% is considered a solid fulfillment rate (common for most campaigns)
- 90% or higher indicates excellent donor follow-up systems
Key factors that influence results:
- Clarity of pledge terms.
- Effectiveness of payment reminders.
- Donor relationship strength.
- Economic conditions.
Best practices for strong fulfillment:
- Set clear expectations upfront.
- Implement consistent (but not excessive) reminders.
- Offer multiple payment options.
- Maintain good donor relationships.
Effective pledge strategies for your fundraising
Tip #1: Leverage events for stronger pledge commitments
- In-person events create natural opportunities for donor engagement
- Our data shows event pledges have an impressive 85% fulfillment rate.
Tip #2: Smart sponsorship payment structures
When securing corporate sponsorships:
- Consider requesting 50% payment upon contract signing.
- Collect the remaining 50% 10 business days before the event.
For example, a $10,000 5K sponsorship would mean:
$5,000 at signing.
$5,000 two weeks before race day.
Tip #3: Donor Pledge Cards
You can download the Donor Pledge Card Template or buy it.
Metrics matter, but donors matter more.

Yes, tracking pledge fulfillment, donor retention, and campaign performance is important—but numbers alone won’t sustain your mission.
The heart of fundraising is relationships. The risk of over-focusing on metrics in fundraising metrics? It can turn donors into data points. So how can you fix that risk? Balance analysis with authentic connection.
How to keep donors at the center
💌 Thank first, track later. For example, you can send personalized gratitude letters or make a quick call before logging the gift in your CRM.
Share impact, not just updates
Donors care more about who they helped than your fulfillment rate. Instead of: “85% of pledges fulfilled!” Try: “Your pledge provided 300 meals—thank you!”
Celebrate milestones together
Recognize long-term supporters publicly (with permission). For example: “Celebrating 5 years of partnership with [Donor Name]!”
Remember: Metrics inform strategy, but relationships fuel sustainability. A 90% fulfillment rate means little if donors don’t feel valued!
Common Pledge Fulfillment Percentage questions answered
A typical pledge fulfillment percentage is 80-90% for most fundraising campaigns. Crowdfunding platforms often average around 85%, while well-managed nonprofit campaigns can reach 90% or higher.
Donor engagement, economic conditions, campaign clarity, follow-up frequency, payment ease, and donor trust. Poor communication or financial hardship can lower rates, while timely reminders and strong relationships improve them.
Improve rates by:
· Sending clear, timely payment reminders.
· Offering flexible payment options (e.g., installments).
· Building donor trust through transparent communication.
· Personalizing follow-ups.
· Using user-friendly payment platforms.
· Engaging donors with updates on campaign impact.
Good: 80-90% or higher, indicating strong donor follow-through and effective management.
Excellent: 90%+ for campaigns with robust systems.
Bad: Below 70%, signaling issues like poor communication or donor disengagement. Below 50% is critical and may require strategy overhaul.
Crowdfunding: ~80-85%, as backers may forget or face financial issues.
Nonprofits: 85-95%, especially with recurring donors and strong follow-up.
Political Fundraising: 75-85%, due to fluctuating donor commitment post-election.
Peer-to-Peer Events: 70-80%, as participants may struggle to collect pledges from their networks.
Rates depend on donor demographics and campaign structure.
· Use CRM software (e.g., Salesforce, DonorPerfect) to log pledges and payments.
· Track via spreadsheets for smaller campaigns, noting pledge amounts, dates, and payment status.
· Automate reminders through fundraising platforms.
· Report progress with dashboards or regular updates to stakeholders, showing pledged vs. collected funds.
· Reconcile payments monthly to ensure accuracy.
Unfulfilled pledges reduce available funds, potentially jeopardizing campaign goals or forcing budget cuts. To mitigate:
· Build a buffer in fundraising targets (e.g., aim for 110% of needed funds).
· Follow up persistently with non-paying donors.
· Seek alternative funding to cover shortfalls.
· Communicate transparently with stakeholders about delays or gaps.
Yes:
· Individual Donors: 75-85%, as personal finances or forgetfulness can lower fulfillment.
· Recurring Donors: 90-95%, due to automated payments and loyalty.
· Corporations: 85-90%, often reliable but delayed by internal processes.
· First-Time Donors: 70-80%, as they may lack commitment or trust.
Rates improve with stronger donor relationships and clear expectations.
For more on Fundraising & Metrics read:
- Calculating the Return on Investment (ROI) in Fundraising
- What is the Gifts Secured Metric? How to calculate and use GSM
- What is Conversion Rate? How to Calculate and Use CR?
- What is the Matching Gift Rate metric? How to calculate and use MGR
- What is Donor Retention Rate? How to Calculate and Use DRR