What is the Gifts Secured Metric in fundraising? How to calculate and use GSM
In this article
- What is the Gifts Secured Metric (GSM) in fundraising?
- Calculating the Gifts Secured metric
- The Importance of the Gifts Secured Metric in fundraising
- Tracking Gifts Secured Metric
- Tips for accurate calculation of Gifts Secured Metric
- How to use Gifts Secured metric in fundraising?
- What is a good Gifts Secured Metric in fundraising?
- Start tracking Gifts Secured Metric (GSM) with RallyUp
- Common Gifts Secured Metric Questions answered
What is the Gifts Secured Metric (GSM) in fundraising?
Gifts Secured is the total number of donations, grants, or pledges your organization has successfully received in a given time frame. This includes cash, pledges, and in-kind contributions—anything that counts as a “yes” from a donor.
Why does it matter?
Tracking this metric helps you see what’s working, where to adjust, and how to improve over time. Gifts Secured gives you a snapshot of your fundraising progress—use it to guide your strategy and build stronger donor relationships.
Quick facts: It tracks the number of donations, not just the dollar amount. (Though both are important!)
A healthy average? 30-50% of prospects say “YES!” (But hey—size and goals matter. Startups and giants play different fields!)
Calculating the Gifts Secured metric
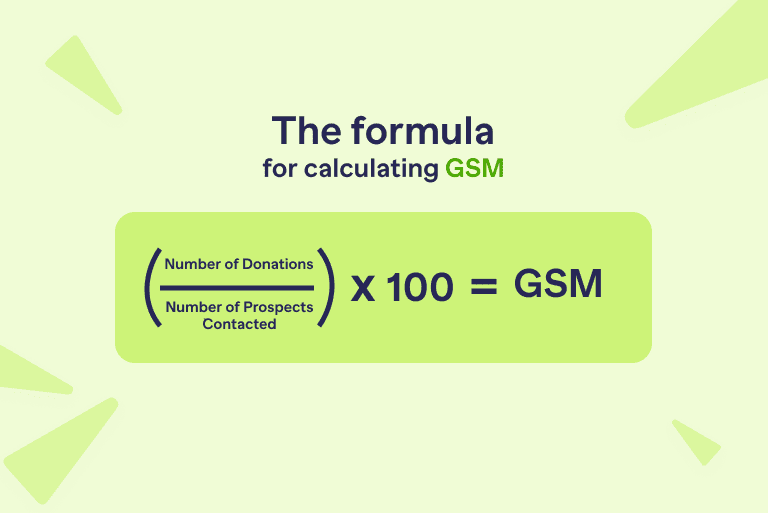
The formula: (Number of Donations ÷ Number of Prospects Contacted) × 100 = Your GSM
For example: If you received 40 gifts out of 100 asks, that’s a 40% success rate.
Gift counting and valuation process
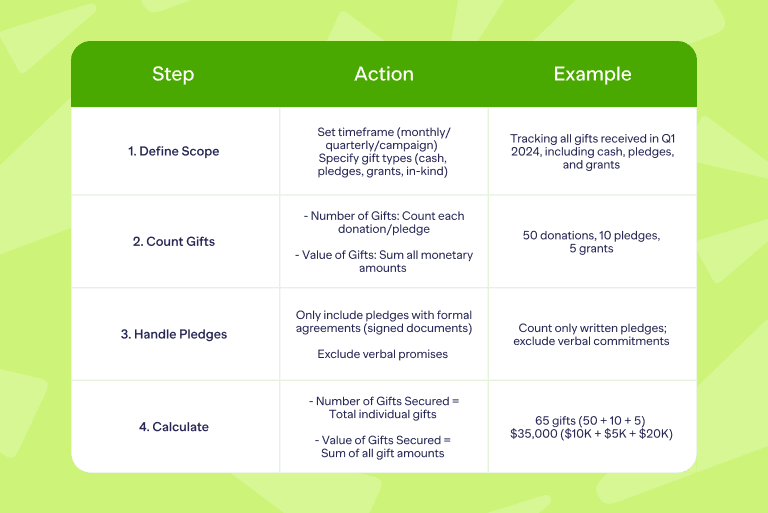
| Step | Action | Example |
|---|---|---|
| 1. Define Scope | Set time frame (monthly/quarterly/campaign) Specify gift types (cash, pledges, grants, in-kind) | Tracking all gifts received in Q1 2024, including cash, pledges, and grants |
| 2. Count Gifts | – Number of Gifts: Count each donation/pledge – Value of Gifts: Sum all monetary amounts | 50 donations, 10 pledges, 5 grants |
| 3. Handle Pledges | Only include pledges with formal agreements (signed documents) Exclude verbal promises | Count only written pledges; exclude verbal commitments |
| 4. Calculate | – Number of Gifts Secured = Total individual gifts – Value of Gifts Secured = Sum of all gift amounts | 65 gifts (50 + 10 + 5) $35,000 ($10K + $5K + $20K) |
Gifts Secured Metric breakdown as an example
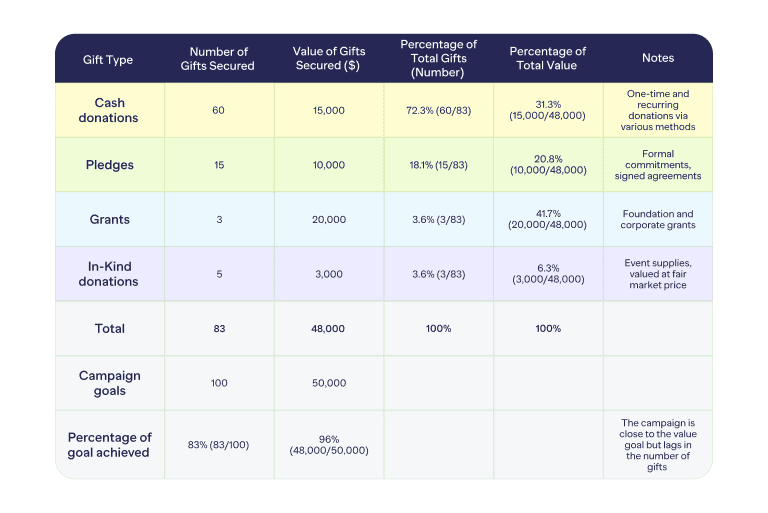
| Gift Type | Number of Gifts Secured | Value of Gifts Secured ($) | Percentage of Total Gifts (Number) | Percentage of Total Value | Notes |
|---|---|---|---|---|---|
| Cash donations | 60 | 15,000 | 72.3% (60/83) | 31.3% (15,000/48,000) | One-time and recurring donations via various methods |
| Pledges | 15 | 10,000 | 18.1% (15/83) | 20.8% (10,000/48,000) | Formal commitments, signed agreements |
| Grants | 3 | 20,000 | 3.6% (3/83) | Foundation and corporate grants | |
| In-Kind donations | 5 | 3,000 | 6.0% (5/83) | Event supplies, valued at fair market price | |
| Total | 83 | 48,000 | 100% | 100% | |
| Campaign goals | 100 | 50,000 | |||
| Percentage of goal achieved | 83% (83/100) | 96% (48,000/50,000) | The campaign is close to the value goal but lags in the number of gifts |
Additional segmentation (Example Assumptions):
By Donor type:
Individuals: 50 gifts, $10,000
Corporations: 20 gifts, $12,000
Foundations: 13 gifts, $26,000
By channel:
Online: 30 gifts, $7,000
Events: 25 gifts, $15,000
Direct Mail: 20 gifts, $5,000
Personal Solicitation: 8 gifts, $21,000
Segmented GSM by donor type and channel
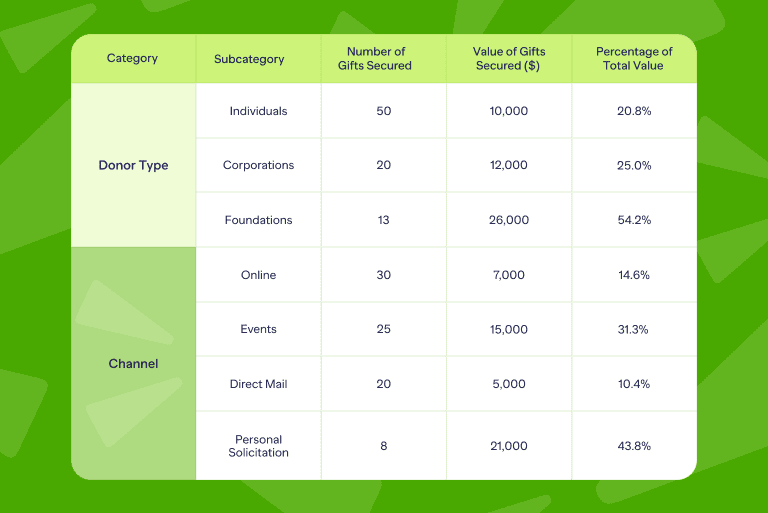
| Category | Subcategory | Number of Gifts Secured | Value of Gifts Secured ($) | Percentage of Total Value |
|---|---|---|---|---|
| Donor Type | Individuals | 50 | 10,000 | 20.8% |
| Corporations | 20 | 12,000 | 25.0% | |
| Foundations | 13 | 26,000 | 54.2% | |
| Channel | Online | 30 | 7,000 | 14.6% |
| Events | 25 | 15,000 | 31.3% | |
| Direct Mail | 20 | 5,000 | 10.4% | |
| Personal Solicitation | 8 | 21,000 | 43.8% |
Tip: Share these tables and graphs with fundraising teams or donors. Include in newsletters or reports to show progress (e.g., “We’re 96% to our $50,000 goal!”) and inspire further giving.
The Importance of the Gifts Secured Metric in fundraising
GSM provides a clear, quantifiable measure of an organization’s ability to attract and secure financial or in-kind support.
A strong Gifts Secured metric demonstrates an organization’s effectiveness in both donor outreach and conversion.
1. Assesses fundraising performance and progress
Performance measurement
- Tracks progress toward financial targets (e.g., securing 40,000 of a 50,000 goal shows 80% completion)
- Identifies successful campaigns and areas needing improvement
- Provides objective data for stakeholder reporting
Strategic insights
- Reveals which donor segments are most responsive
- Highlights effective fundraising channels
- Informs future campaign planning
Accountability
- Demonstrate results to board members and donors
- Justifies resource allocation decisions
- Supports transparent operations
2. Drives strategic decision-making
Resource optimization
- Identify high-performing channels (e.g., digital vs. direct mail) and donor segments to allocate budgets effectively.
For example: If online campaigns yield 60% of secured gifts, shift resources from lower-performing channels. - Trend analysis
- Uncover patterns like seasonal spikes (e.g., year-end surges) or preferred gift types (pledges vs. one-time).
- Use these insights to time campaigns and tailor donor outreach.
Team performance
- Replicate successful strategies from top-performing staff or volunteers.
- Address skill gaps with targeted training where results lag.
3. Strengthens donor relationships
Behavioral insights
- Segment donors by gift size/frequency to personalize engagement.
For example: If major donors drive 70% of secured gifts, prioritize dedicated stewardship.
Pledge accountability
- Monitor fulfillment rates to spot gaps in follow-up or donor communication.
- Implement reminders or clarify terms to improve conversions.
Transparency & trust
- Share milestones (e.g., 100 gifts secured this quarter!) to demonstrate impact and motivate ongoing support.
4. Strengthens financial health
Cash flow forecasting
- Track cash donations and fulfilled pledges to predict revenue and align program budgets accordingly.
For Example: If Q1 gifts secured average $50K, use this baseline for mid-year financial planning.
Proactive gap management
- Monitor shortfalls against projections to pivot quickly—whether securing emergency grants or adjusting expenses.
Sustainable growth
- Year-over-year increases in gifts secured signal donor base stability and revenue diversification—keys to long-term success.
5. Team morale and momentum
Celebrates milestones
- Share wins like “$25K secured this quarter!” to motivate staff and validate donor impact.
Friendly competition
- In Peer-to-Peer campaigns, rank individual/team gifts secured to boost participation.
Reinforces impact
- Tie metrics to outcomes (e.g., “Every 10 gifts = one student scholarship”) to reinforce purpose.
Why it matters: Beyond measuring success, gifts secured powers financial stability, team motivation, and stakeholder trust—making it indispensable for strategic growth.
Tip: Pair with donor retention rates for a complete fundraising health check.
Tracking Gifts Secured Metric
1. Core metrics to monitor

| Metric | What to track | Why it matters |
|---|---|---|
| Volume | Total number of gifts/pledges | Measures donor engagement |
| Value | Sum of all gift amounts | Tracks financial progress |
| Sources | Online/events/mail/major gifts | Identifies the best channels |
| Donor Types | Individuals/corporations/foundations | Reveals donor base composition |
| Gift Tiers | Major ($1K+), mid-level, small | Guides cultivation strategies |
2. Tracking tools comparison
For growing organizations:
- Fundraising CRMs
- Auto-log gifts from all channels
- Generate real-time reports
- Segment data effortlessly
For startups/small teams:
- Spreadsheets (Google Sheets/Excel)
- Manual entry with columns for:
- Donor info
- Gift amount/date
- Campaign/source
- Manual entry with columns for:
- Payment platforms (Stripe, PayPal)
- Direct donation imports
3. Smart segmentation (an example of segmentation)
4. Common pitfalls & fixes
| Challenge | Solution |
|---|---|
| Inconsistent data | Create a gift logging cheat sheet |
| Unfulfilled pledges | CRM reminders + donor check-ins |
| Manual entry errors | Adopt affordable CRM tools |
| In-kind undervaluing | Use fair market value standards |
Recommended tech stack:
- Entry level: Google Sheets + PayPal
- Mid-tier: Fundraising software + Stripe
- Enterprise: Salesforce NPSP + fundraising software
Key insight: Pair gifts secured metric with donor retention rates and average gift size metric for a 360° view of fundraising health.
Tips for accurate calculation of Gifts Secured Metric
We’ll cut to the chase:
1. Segment the data
Slice and dice your data! Break it down by:
- Donor type (Individuals? Corporations? Foundations?)
- Gift size (Who’s giving big? Who’s just getting started?)
- Campaign (Which one’s crushing it?)
Why? Spot hidden trends and double down on what works!
3. Mix & match metrics
Don’t let gifts secured fly solo! Pair it with other metrics:
- Donor retention rate (Are they coming back for more?)
- Average gift size (Is it growing?)
- Cost per dollar raised (Are you spending smart?)
Pro Tip: More metrics don’t mean sharper decisions.
3. Use software
Ditch the spreadsheets! Let Fundraising CRMs such as Salesforce or Donor Perfect do the job. They’ll:
- Track gifts automatically.
- Generate reports in a snap.
- Save you time (and headaches!).
4. Stay on your toes
Stay agile and responsive! Weekly or monthly reviews help you catch problems early.
How to use Gifts Secured metric in fundraising?
| Purpose | Action | Example |
|---|---|---|
| Track progress | Compare secured gifts vs. goals to measure campaign success. | 35K secured out of 50K goal = 70% progress. |
| Evaluate strategies | Analyze which channels/donor segments perform best; reallocate efforts. | Online campaigns brought 60% of gifts—focus more there! |
| Engage donors | Identify trends (e.g., recurring gifts, pledge drop-offs) to refine outreach. | Increase follow-ups if pledges aren’t converted to cash. |
| Report to stakeholders | Share metrics to show impact and build trust. Highlight wins! | 100 gifts were secured this quarter! Thank you, donors! |
| Forecast revenue | Use past data to set future goals. | Averaging 10K/month? Project 120K/year. |
| Measure team performance | Track gifts secured per staff/volunteer to assess effectiveness. | Sarah secured 20 gifts this month—top performer! |
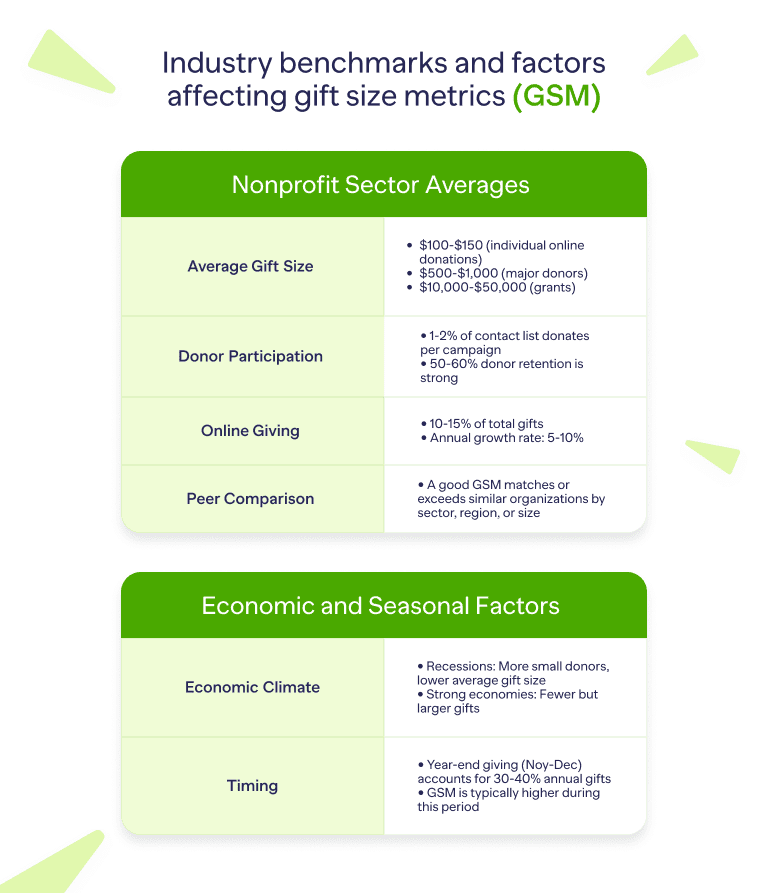
What is a good Gifts Secured Metric in fundraising?
While specific targets vary, here are general benchmarks for a good GSM, based on industry data and fundraising best practices.
Fundraising Benchmarks for a good Giving Strategy (GSM)
Number of Gifts Secured
- Small Nonprofits (<$500,000 budget): 50–200 gifts per campaign or 500–1,000 annually.
- Mid-Sized Nonprofits ($500,000–$5M budget): 200–1,000 gifts per campaign or 1,000–5,000 annually.
- Large Nonprofits (>$5M budget): 1,000+ gifts per campaign or 5,000–50,000 annually.
- Campaign-Specific:
- Annual Fund: 10–20% of donor base contributing (e.g., 100 gifts from a 1,000-person list).
- Events: 50–500 gifts, depending on scale.
- Capital Campaigns: 20–100 gifts, often from major donors or institutions.
- Donor Retention: 50–60% of gifts from repeat donors are good; 70%+ is excellent.
- New Donors: 10–20% of gifts from new donors indicate healthy growth.
Value of Gifts Secured
- Small Nonprofits: $10,000–$50,000 per campaign or $100,000–$500,000 annually.
- Mid-Sized Nonprofits: $50,000–$250,000 per campaign or $500,000–$2M annually.
- Large Nonprofits: $250,000–$1M+ per campaign or $2M–$50M+ annually.
- Average gift size:
- Small donors: $50–$150.
- Mid-level donors: $150–$999.
- Major donors: $1,000–$10,000+.
- Grants: $5,000–$100,000+.
- Percentage of goal: Achieving 80–100% of the campaign or annual fundraising goal is good; exceeding 100% is excellent.
- Revenue mix:
- 60–80% from major donors/grants and 20–40% from small/mid-level donors is typical for established nonprofits.
- 10–30% from online giving is strong for digitally active organizations.
Progress toward goals
- 80–90% of the goal: Indicates a strong campaign but may need a final push.
- 100% of the goal: Meets expectations and is considered successful.
- >100% of the goal: Exceptional performance, often due to unexpected large gifts or high donor turnout.
Channel performance
- Online giving: 10–20% of total gifts secured, with 5–10% growth year-over-year.
- Events: 20–50% of total value for event-driven campaigns.
- Direct mail: 5–15% of total gifts, with higher response rates (1–3%) for targeted appeals.
- Personal solicitation: 30–50% of total value, especially for major gifts.
Practical benchmarks by organization type
- Small Nonprofits (e.g., local charities):
- Good GSM: 50–100 gifts, $10,000–$50,000 per campaign; 80–90% of goal.
- Focus: Broad participation, small donors, local events.
- Mid-Sized Nonprofits (e.g., regional NGOs):
- Good GSM: 200–500 gifts, $50,000–$200,000 per campaign; 90–100% of goal.
- Focus: Mix of major donors, grants, and online giving.
- Large Nonprofits (e.g., national organizations):
- Good GSM: 1,000+ gifts, $250,000–$1M+ per campaign; 100%+ of goal.
- Focus: Institutional grants, major donors, and scalable digital campaigns.
A high Gifts Secured metric? That means your org is killing it at winning over donors—and turning them into loyal supporters! It is proof that your outreach is magnetic and that your campaigns pop. And your process? Smooth as butter. Donors aren’t just interested—they’re all in.
Resources for benchmarks:
Start tracking Gifts Secured Metric (GSM) with RallyUp
RallyUp doesn’t have a native GSM tracker—yet—but that hasn’t stopped nonprofits from getting powerful insights using campaign-level reports.
Nonprofits are already using RallyUp’s built-in campaign summaries to reverse-engineer their Gifts Secured Metric by extracting:
- Total number of donations
- Number of donors
- Donation channels
- Gift types (e.g., cash vs. pledge vs. in-kind)
How it works
Common Gifts Secured Metric Questions answered
Gifts include cash donations (one-time or recurring), pledges (formal commitments to donate later), grants (from foundations or corporations), and in-kind donations (goods or services, e.g., event supplies). Planned gifts may be included if relevant to the campaign.
A good GSM meets 80–100%+ of campaign goals, aligns with industry benchmarks, and balances gift types. For small nonprofits, 50–200 gifts worth $10,000–$50,000 per campaign is strong; for large ones, 1,000+ gifts worth $250,000–$1M+.
Track GSM daily or weekly during active campaigns for real-time adjustments, and monthly or quarterly for ongoing fundraising.
Use fundraising CRMs (e.g., Salesforce, Donor Perfect, Blackbaud) for automated tracking, segmentation, and reporting. Payment platforms (e.g., Stripe) capture online gifts, while spreadsheets (Excel, Google Sheets) work for smaller organizations.
Assign in-kind donations a fair market value (e.g., retail price for goods, standard hourly rate for services).
GSM identifies donor behavior (e.g., repeat vs. new donors, gift size), enabling personalized stewardship. For example, high gift counts from individuals (72.3% in the earlier example) signal strong engagement.
GSM focuses on gifts secured (inputs), while other metrics like donor retention rate (50–60% is good), cost per dollar raised ($0.10–$0.20 is efficient), or return on investment (3:1 or higher) measure retention, efficiency, or outcomes. Pair GSM with these for a holistic view.
Base goals on:
Historical GSM (e.g., if last year was 100 gifts at $40,000, aim for 120 gifts at $50,000).
Donor base size (e.g., 10–20% participation rate).
Campaign type (e.g., capital campaigns target fewer, larger gifts).
Industry benchmarks (e.g., $100–$150 average gift).
For more articles on fundraising metrics, read:
- What is Pledge Fulfillment Percentage in fundraising? How to calculate and use PFP?
- 42 Fundraising KPIs and Metrics Everyone Should Measure
- Calculating the return on investment (ROI) in fundraising
- What is the Matching Gift Rate metric? How to calculate and use MGR
- What is Donor Retention Rate? How to Calculate and Use DRR