How To Create a Nonprofit Impact Report in 6 Steps? (+ a Free Template to Get You Started)
What Is a Nonprofit Impact Report?
- A nonprofit impact report shows donors the change their contributions made for the cause.
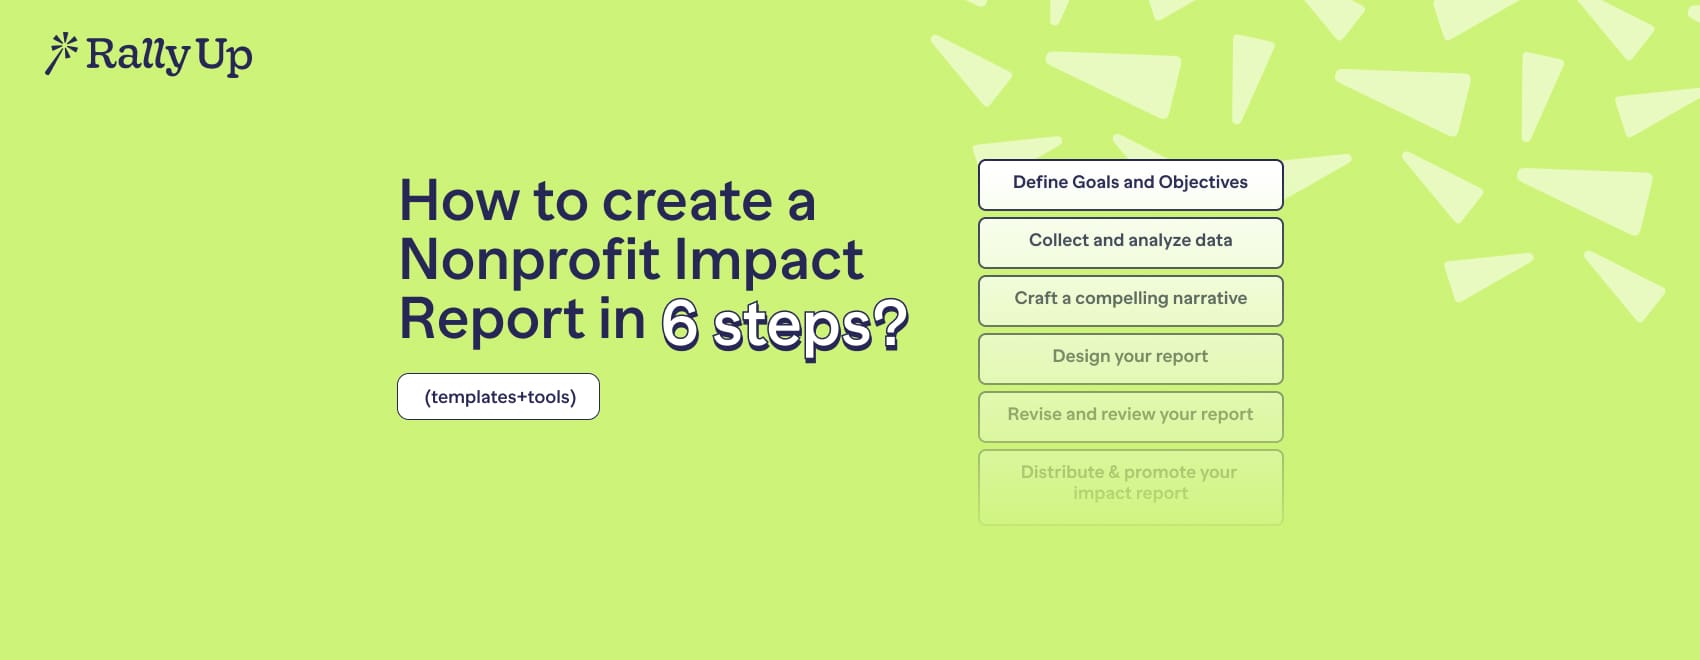
- Creating an impact report:
- Start with the objective of the report
- Define impact before programs
- Measure change, not activity
- Make the funding: impact connection
- Design for skimming
- Close with momentum
- Use tools like RallyUp, an end-to-end fundraising platform, which helps centralize fundraising + donor engagement data and can integrate with CRMs.
Most nonprofit reports are polite. Safe. Completely forgettable.
A nonprofit impact report isn’t supposed to be any of those things. It exists to answer one uncomfortable question donors are thinking: Did I really make a difference?
Supporters don’t want long program descriptions or glossy PDFs. Supporters want clear outcomes in a skimmable format; PDF is fine if it’s designed for quick reading and mobile.
A strong nonprofit impact report is supposed to connect your mission to measurable results and make the case for continued support.
In this guide, we break down how to build a nonprofit impact report that people actually read, trust, and act on, without turning it into another report that gets skimmed and ignored.
In this article
- What is a nonprofit impact report?
- What does a nonprofit impact report include?
- Nonprofit impact report vs annual report (clear comparison)
- How to create a nonprofit impact report that triggers action
- The most meaningful KPIs to include in a nonprofit impact report
- Nonprofit impact report template (Ready-to-use)
- 6 tools and software for tracking nonprofit impact metrics
- What mistakes do nonprofits make with impact reports?
- Final takeaway: Creating and tracking impact with RallyUp
- FAQs about nonprofit impact report
What is a nonprofit impact report?
Let’s take into consideration this scenario: You donate. You feel good about it. You move on. A few months later, you receive an email. It’s a report – you open it, but it results in you wondering if your donation was even worth it.
You see numbers, programs, maybe a photo. But you’re still asking the same thing: Did my donation even change anything?
A nonprofit impact report exists to get rid of that doubt. It’s not a list of activities or a recap of the nonprofit’s year, so don’t confuse it with the annual report.
An impact report is a clear, outcome-focused way to show what changed because of supporters. What improved, what didn’t, and why it mattered.
Why is a nonprofit impact report important?
A nonprofit impact report is especially important because when donors can’t see impact, they stop trusting the outcome, even if the work is good.
- It connects donations to measurable results, not assumptions
- Funders use it to justify renewals and continue funding
- Leadership uses it to spot what’s working and what needs fixing
- Without a nonprofit impact report, supporters are left guessing
- It increases the chances of repeat giving and donor retention
What does a nonprofit impact report include?
A nonprofit impact report should be intentional. Every section needs to earn its place by helping the reader understand the impact, along with the effort.
Here’s what a strong nonprofit impact report includes:
- Mission and problem statement: A clear explanation of the problem you exist to solve. Not a vision paragraph, but context that frames why your work matters.
- Programs connected to outcomes: A high-level overview of key programs, paired with what actually changed because they ran.
- Impact metrics and KPIs: The core of the nonprofit impact report. These show progress, effectiveness, and scale using measurable data.
- Baseline & timeframe: Outcomes are measured over a defined period and compared against pre-program benchmarks.
- Who’s included: Metrics reflect participants who completed the program during the reporting window.
- Attribution vs contribution: Results represent the nonprofit’s contribution alongside partners and external factors.
- Limitations: Some outcomes take longer to measure and are still being evaluated.
- Beneficiary reach and depth: Who was impacted, how many people were reached, and how meaningful that impact was, instead of simply adding raw counts.
- (Optional) Beneficiary snapshot: Short example that illustrates an outcome already shown in the metrics (1-2 lines max).
- Financial context, not financial overload: A glimpse of how their funding supported the outcomes, without burying readers in full audited statements.
- Learnings and next steps: What worked, what didn’t, and what you’re improving next. This signals accountability and forward momentum.
Quick tip
Read through the report as a donor. If a section doesn’t help you quickly understand what changed or why it mattered, cut it. A nonprofit impact report has to relay the importance of donors’ contributions to your cause
Nonprofit impact report vs annual report (clear comparison)
Herein lies the question: isn’t an impact report the same as an annual report? Short answer: no. And treating them as the same thing is where many nonprofits lose their retention opportunity.
An annual report tells people what happened over the year: Things like cost-per-dollar raised, leadership updates, compliance, and summaries of activity.
On the other hand, a nonprofit impact report focuses on what changed. It shows outcomes, impact metrics, and progress toward the mission.
| Area | Nonprofit Impact Report | Annual Report |
|---|---|---|
| Core question answered | What changed because we exist? | What did we do this year? |
| Primary focus | Outcomes, results, and progress | Finances, governance, summaries |
| Type of metrics | Mission-driven KPIs and impact data | Financial statements and activity counts |
| Story being told | How support led to measurable change | How the organization operated |
| Primary audience | Donors, funders, community supporters | Boards, regulators, internal stakeholders |
| Role in fundraising | Builds confidence and repeat giving | Supports compliance and transparency |
| Timing & flexibility | Can be published anytime | Annual and fixed |
How to create a nonprofit impact report that triggers action
Creating a nonprofit impact report isn’t about documenting everything you did. It’s about guiding the reader, usually a donor or funder, to one clear conclusion: supporting this work makes sense.
That means structure, intent, and discipline matter more than word count.
Step 1: Start with the decision you want the reader to make
Before you write a single line, decide what the report will achieve.
Do you want the reader to:
- Donate again
- Renew a grant
- Increase their contribution
- Continue backing a specific program
Quick fact
These might seem like things to add in an appeal letter but that is a whole different ballpark. An impact report can include an appeal letter but an appeal letter may not include the same details.
For example, a donor considering renewal doesn’t need the full organizational history. They need proof that last year’s funding led to measurable results and that future funding will do the same.
Every section in your nonprofit impact report will now support that decision.
Step 2: Define impact before you describe your programs
One of the biggest mistakes nonprofits make is leading with programs. Instead, start with the change you’re trying to create.
For example:
- Not: “We ran 120 after-school sessions.”
- But: “Students attending our program improved reading proficiency by 28% over six months.”
Activities explain how you worked. Impact explains why it mattered. A strong nonprofit impact report always puts outcomes first, then uses programs as supporting evidence.
This shift instantly makes your report more persuasive and easier to understand.

Step 3: Choose metrics that prove change
Not all data belongs in a nonprofit impact report.
Good metrics show:
- Progress over time
- Depth of impact, not just reach
- A clear connection between effort and outcome
For example:
- Replace “Meals served” with “Reduction in food insecurity among participating families.”
- Replace “Workshops conducted” with “Percentage of participants who secured employment within 90 days.”
Step 4: Connect funding directly to outcomes
This is where many impact reports fall apart.
Donors want to know what their donations made possible. Your nonprofit impact report should clearly link funding to results.
For example:
- “$50,000 funded mobile clinics that reached 1,200 patients”
- “Grant support allowed us to expand services into two underserved regions”
This doesn’t require a full financial breakdown. It requires clarity. When funding and outcomes are connected, the value of continued support becomes obvious.
Step 5: Design for skimming
Most people will not read your nonprofit impact report start to finish. That’s normal. Design it so key points are impossible to miss:
- Headline metrics at the top of sections
- Short paragraphs
- Clear subheadings
- Simple language
If a donor can understand your impact in five minutes, you’ve done it right. If they need twenty, you’ve lost them.
Step 6: End with momentum instead of a summary
Don’t end your nonprofit impact report by restating what the reader already knows.
End by answering:
- What’s next?
- What still needs support?
- What opportunity exists to deepen impact?
This could be expansion, refinement, or a specific funding need. A nonprofit impact report that triggers action always leaves the reader knowing what role they can play next.

The most meaningful KPIs to include in a nonprofit impact report
The KPIs in a nonprofit impact report are based on how donors, funders, and evaluators already assess nonprofits when deciding whether to continue, increase, or withdraw support.
Start measuring from the beginning. Track these 42 KPIs during fundraisingThese metrics are shaped by:
- Grant evaluation frameworks used by institutional funders, where outcomes matter more than activity counts
- Monitoring and Evaluation (M&E) models – commonly used across education, health, and social impact sectors
- Donor behavior and retention analysis, which shows repeat giving is driven by clarity of impact, not volume of work
- Nonprofit accountability standards, where effectiveness, efficiency, and learning are core signals
Because of this, meaningful KPIs consistently fall into four categories.
1. Program effectiveness KPIs
Drawn from: Grant evaluation frameworks and M&E models
- Outcome completion rate → Whether participants achieved the intended outcome
- Pre- vs post-intervention change → What measurably improved after the program ran
- Cost per outcome → Resources required to produce one successful result
These KPIs exist because funders evaluate whether programs deliver results relative to resources used.
2. Beneficiary impact KPIs
Drawn from: Social impact evaluation models
- Number of beneficiaries served (with context) → Who was reached and why it matters
- Retention or follow-through rate → Whether beneficiaries stayed engaged long enough to benefit
- Outcome durability → Whether the impact lasted beyond participation
These metrics are used to assess the depth of impact.
3. Operational impact KPIs
Drawn from: Nonprofit capacity and sustainability frameworks
- Program scalability → Ability to grow without proportional cost increases
- Resource efficiency → Effectiveness of staff, volunteers, and infrastructure
- Time-to-impact → Speed at which outcomes are achieved
Funders use these KPIs to judge whether increased support will strengthen or strain operations.
4. Trust and sustainability KPIs
Drawn from: Donor behavior and funding continuity analysis
- Donor retention linked to impact reporting → Whether supporters continue giving after seeing results
- Restricted fund utilization clarity → Whether funds were used as intended
- Repeat funding for specific programs → Ongoing support tied to demonstrated outcomes
These KPIs reflect trust – a critical but measurable factor in funding decisions.
Nonprofit impact report template (Ready-to-use)
This nonprofit impact report template is designed to show impact quickly, build trust, and support funding decisions.
Ready-to-use nonprofit impact report template6 tools and software for tracking nonprofit impact metrics
If your impact data is spread across tracking apps, emails, and five different people’s laptops, your nonprofit impact report is already compromised.
It slows reporting, introduces errors, and makes it harder to confidently show how funding turned into outcomes. That’s why nonprofits should eventually move to reporting software for nonprofit impact metrics.
1. RallyUp – End-to-end fundraising platform
The hardest part of creating a nonprofit impact report is connecting fundraising data, donor behavior, and program outcomes without spending weeks reconciling numbers.
RallyUp solves that by keeping campaign data, CRM integrations, and donor profiles connected in one system.

In practical terms, this means you can:
- See which campaigns funded which programs, without manual cross-checking
- Pull donor-level data directly into impact reporting instead of rebuilding it in spreadsheets
- Track repeat giving and engagement through donor profiles, which feeds directly into trust and sustainability KPIs
- Reduce data gaps and inconsistencies that slow down or weaken a nonprofit’s impact report
That means less manual cleanup and an impact report that clearly answers the question: what did my support make possible?
2. Salesforce Nonprofit Cloud
Nonprofit Cloud is used by mid-to-large nonprofits that need structured donor, grant, and program data in one place. It’s especially useful when impact reporting needs to pull from multiple funding sources.
Where it adds value to a nonprofit impact report:
- Tracks donor history, gift frequency, and restricted funds
- Supports long-term donor retention analysis tied to reporting cycles
- Helps funders and boards audit how funding aligns with outcomes
It’s powerful, but only if data discipline already exists internally.
3. Bloomerang
Bloomerang is used for donor retention and engagement tracking, which makes it useful for the trust and sustainability side of a nonprofit impact report.
Where it adds value:
- Shows donor retention trends after reports are shared
- Helps identify which segments respond to impact communication
- Supports reporting on repeat giving and donor confidence
It’s less about deep program evaluation and more about understanding supporter behavior.
4. Charity Navigator’s impact reporting framework
Charity Navigator isn’t primarily an impact-reporting software, but nonprofits can submit data via the Charity Navigator Nonprofit Portal.
Nonprofits use it in three practical ways:
- Credibility check: Use the Charity Navigator framework as a benchmark to spot gaps in outcomes, transparency, and clarity before publishing an impact report.
- Expectation alignment: Since many donors and funders rely on Charity Navigator ratings, align your impact report with the outcome-focused signals donors already trust.
- Outputs → outcomes shift: The framework helps teams move away from listing activities and toward clearly stating what actually changed because of their work.
5. Logic models and M&E tools (e.g., LogAlto, DHIS2)
Tools like LogAlto and DHIS2 are used in program-heavy nonprofits, especially in health, education, and international development.
Where they add value:
- Track pre- and post-intervention data
- Measure outcome durability
- Standardize impact measurement across locations or programs
This is typically where outcome KPIs in a nonprofit impact report originate.
6. Tableau/Power BI
Tableau and Power BI are commonly used to make data readable for non-technical audiences.
Where they add value:
- Turn raw metrics into skimmable visuals
- Highlight trends instead of isolated numbers
- Reduce explanation time during donor or board reviews
While they don’t create impact, they determine whether impact is understood.
What mistakes do nonprofits make with impact reports?
Even well-run nonprofits mess this up. Here are the mistakes that kill trust and momentum, and how to rectify them:
| Mistake | What goes wrong | How to fix it |
|---|---|---|
| Reporting activities instead of outcomes | Readers see effort, not results | Lead with measurable change before listing programs |
| Including too many metrics | Key impact gets buried | Limit KPIs to those tied to funding and outcomes |
| Only highlighting successes | Report feels selective or promotional | Include learnings and gaps alongside wins |
| Separating funding from impact | Donors can’t see how money helped | Explicitly link funding sources to outcomes |
| Writing for reading, not skimming | Important insights get missed | Use headline metrics, short sections, and tables |
| Treating the report as a one-time task | Data becomes outdated quickly | Track metrics every month/campaign |
Final takeaway: Creating and tracking impact with RallyUp
Creating impact comes easily for nonprofits, it’s proving it clearly and consistently where they struggle.
A nonprofit impact report closes that gap by showing what changed, why it mattered, and how support made it possible. When outcomes are easy to understand, funding conversations become easier too.
One practical rule: design impact before you report it. When programs, fundraising, and donor data are aligned from the start, reporting becomes a byproduct.
RallyUp, an end-to-end fundraising platform, helps centralize fundraising + donor engagement data and can integrate with CRMs.
See how RallyUp helps nonprofits create impact and track it tooFAQs about nonprofit impact report
Most nonprofit reports summarize activities or finances, while a nonprofit impact report focuses specifically on outcomes and measurable change created by your work.
An impact report nonprofit teams rely on doesn’t have to be annual—it should be updated whenever meaningful outcomes are ready to share with donors and funders.
Yes. A nonprofit impact report template helps small teams structure results clearly without complex tools, making impact reporting easier and more consistent.