
42 Fundraising KPIs and Metrics Everyone Should Measure
In this article
- Listen on the go
- What are nonprofit fundraising metrics?
- Why is tracking fundraising KPIs and metrics essential?
- Tips for improving nonprofit fundraising KPIs
- KPIs and metrics that measure fundraiser success.
- 1. Cost per dollar raised (CPDR)
- 2. Fundraising return on investment (ROI)
- 3. Conversion rate
- 4. Gifts secured
- 5. Matching gift rate
- 6. Event conversion rate
- 7. Pledge fulfillment percentage
- 8. Recurring gift percentage
- 9. Board member participation rate
- 10. Non-donation revenue
- 11. Fundraising pipeline velocity
- 12. Donor retention rate
- 13. Lapsed donor rate
- 14. Donor growth rate
- 15. Donor lifetime value (DLV)
- 16. Number of donors by type
- 17. Donor acquisition cost
- 18. Demographic metrics
- 19. Donor journey completion rate
- 20. Gift frequency
- 21. Average gift size
- 22. Average giving capacity
- 23. Average gift size growth
- 24. Frequency of contact with donors
- 25. Fundraising participation rate
- 26. Asks made
- 27. Event attendance rate
- 28. SMS response rate
- 29. Peer-to-Peer fundraising success rate
- 30. Text-to-Give conversion rate
- 31. Online gift percentage
- 32. Email open rate
- 33. Email click-through rate
- 34. Email opt-out rate
- 35. Website page views
- 36. Landing page conversion rate
- 37. Amplification rate
- 38. Applause rate
- 39. Google ads click-through rate
- 40. Social media conversion rate
- 41.Social media shares per campaign
- 42.Cart abandonment rate
- KPI Formulas
- Steps to start tracking fundraising performance metrics
Listen on the go
Don’t have the time to read this article? No problem! You can now listen on the move, hit the play button below to start listening.
As a nonprofit pro, you’re all in. You research fundraising software, find donors, market your mission, plan events, follow up, and more. But how do you know it’s all paying off?
Enter nonprofit fundraising metrics—also known as KPIs. These little numbers are your strength! Track them and you can improve your strategies, fine-tune your programs, and up your fundraising results overall. But don’t just collect data for the fun of it—use it!
Too many nonprofits gather info and do nothing with it. That’s a waste! If you’re not using the data, skip the reports. Start small—personalize your messages or refresh your donation form. Every little bit counts.
KPIs can be financial or non-financial and span across your whole organization. In this guide, we’ll break down everything you need to know to start tracking and winning big with your fundraising metrics.
The best fundraising leaders are pros at understanding their performance metrics and proving how every dollar invested brings in more. When you really get your ROI, it’s way easier to pitch for more investment because you know it’ll pay off big time.
What are nonprofit fundraising metrics?
Nonprofit fundraising metrics, or key performance indicators (KPIs), are all about showing how well your nonprofit is hitting its key goals.
Data isn’t the issue. More data won’t fix anything. What matters is HOW you use it—smartly and purposefully!
Nonprofits use metrics on two levels. “High-level” KPIs give you the big picture, tracking overall performance. “Lower level” KPIs dive deep into specific parts of your strategy.
KPIs vs. Metrics
KPIs are all about measuring business goals. They rely on metrics, which track the nitty-gritty activities in different areas of nonprofits.
Why is tracking fundraising KPIs and metrics essential?
Tracking KPIs is a paradigm shifter, even for a brand-new nonprofit! It’s packed with benefits that’ll set you up for success. Here’s why it’s a must:
- Collect accurate, reliable data about your organization.
- Build detailed donor and prospect profiles.
- Make decisions based on real, solid evidence.
- Get rid of the guesswork when evaluating your success.
- Spot what’s working—and what needs improvement.
Without actionable insights from tracking your metrics, you’re left to guess.
Let’s say you ask, “would offering a special event for top donors increase future donations?” If you don’t track how many attendees donate again afterward, you won’t know if the event made a real impact.
Tips for improving nonprofit fundraising KPIs
1. Zero in on the KPIs that drive results
It’s tempting to track everything—but less is more. Focus on the goals and initiatives that are key to your nonprofit. Too much data can overwhelm your team, leaving everyone stuck, not sure where to start or what to tweak.
- Lagging KPIs measure past performance—what happened. Think about average gift size, number of gifts, or event attendance.
- Leading KPIs predict future performance—what’s coming. Examples? Donor retention rate, donor growth, or donation growth.
By tracking both, you get the full picture of where your nonprofit is now and where it’s headed!
2. Use software to track the numbers
Don’t sleep on fundraising tech! Tracking lots of KPIs means diving into tons of data. And manually calculating it? That’s a recipe for mistakes and wasted time.
That’s where solid fundraising software comes in! It’s your best friend for keeping things accurate and saving your team’s sanity.
If you’re not sure where to start, reach out to us at RallyUp. It’s literally our mission to make fundraising tech simple and easy for nonprofits. Whether you’re after beginner-level data or advanced reporting, RallyUp has everything you need.
You could try doing it yourself—or let one of your team members learn it. We’re sure they’ll become certified data whiz’s in no time!
3. Give it time
Do you have less data than you wanted to collect? Even so, this may not always give you the full picture of NPO performance. It takes time to spot real patterns and trends that show your nonprofit’s true performance.
More time = more data. More data = better decisions!
Don’t try to track it all. Focus on the KPIs that matter most for your nonprofit’s long-term goals.
KPIs and metrics that measure fundraiser success.
These KPIs give you a clear view of how well your nonprofit is generating revenue. They help you see what’s working and where you can level up.
Remember that you don’t have to track them all. Align them with your long-term goals.
1. Cost per dollar raised (CPDR)
What is it?
Cost per dollar raised is commonly used and it answers one key question: Did we raise money, break even, or lose money?
CPDR is an ideal solution for individual fundraising events.
How do you calculate it?
Easy! Just divide your expenses by your revenue for the event, campaign, or time period.
• If expenses and revenue are the same, CPDR = 1. You broke even—every dollar spent brought in a dollar.
• If expenses are higher than revenue, CPDR > 1. Ouch! You’re in the red.
• If CPDR < 1, you made a profit! More revenue than expenses—woohoo!
Example of CPDR in action
You spent $1,000 to throw an event and raised $4,000. Looks good, right? But what’s the real ratio? Let’s do the math:
$1,000 / $4,000 = 0.25
That means for every dollar raised, you only spent $0.25. That’s a solid win!
2. Fundraising return on investment (ROI)
What is it?
Fundraising ROI is another go-to metric for nonprofits, just like CPDR. It tells you whether a fundraising effort was a win or a loss.
Both CPDR and fundraising ROI tell you the same thing, just in different ways. So, why choose one over the other?
If your focus is cutting costs, CPDR is your solution. But if you’re planning ahead and thinking about future fundraising, fundraising ROI is the way to go.
3. Conversion rate

What is it?
Conversion rate shows how well your campaign got people to take action—whether it’s donating, signing up, or attending an event.
It’s one of the simplest ways to measure success. By tracking conversion rates, you can figure out how your supporters like to give and which outreach methods are hitting the mark.
First, define your goal action. What do you want your audience to do? For a direct mail campaign, it might be mailing back a donation check. For an email about volunteering, it could be registering for your volunteer program. Simple, right?
How do you calculate it?
To calculate your conversion rate, just divide the number of people who took action by the number of people you reached. Then, multiply that by 100 to turn it into a percentage.
Example of KPI in action
Let’s say you sent an email to 300 donors, asking them to follow a link and donate online. Out of those 300, 120 clicked the link and donated.
Now, let’s do the math:
120 / 300 = 0.4
0.4 x 100 = 40%
Your conversion rate? 40%! That means your campaign had a 40% success rate. Great job!
4. Gifts secured
What is it?
Gifts secured measure how many donations you’ve received in a specific period. Track this over time, and you’ll see your donation growth.
You can break it down by gift type, too:
- Monthly donations
- Mid-level gifts
- Major gifts
- Planned gifts
- Annual fund donations
- Small gifts
This helps you see where your outreach is hitting the mark—and where you might need to step it up!
Example of KPI in action
Let’s say you received 3,200 donations in 2023. Your gifts secured metric would simply be 3,200. Straightforward!
If you’re measuring small gifts, you might have received 150 small donations. Just report that number—150—no need for any complicated calculations!
5. Matching gift rate
What is it?
Your nonprofit’s matching gift rate is the percentage of donations that get matched through corporate philanthropy. It shows how many donors are taking advantage of their employer’s matching gift programs.
Matching gifts don’t cost donors a penny more, and they double the impact of their gifts! So, not telling your supporters about this opportunity? That’s like leaving free money on the table!
Invest in matching gift software. It simplifies everything for your nonprofit and donors. Donors can easily check if they’re eligible, and you can send automated follow-ups to remind them to submit matching gift requests.
Better yet, features like auto-submission make the process even smoother. All donors have to do is enter their corporate email, and the software takes care of the rest! That means no more missed matching gift opportunities.
Example of KPI in action
Imagine you ran a donation drive and want to know how many donors got their gifts matched. Out of 750 donors, 400 submitted matching gift requests to their employers.
Here’s the math:
400 / 750 = 0.533
0.533 x 100 = 53.3%
Your matching gift rate? 53.3%—over half of your donors took advantage of matching gift programs! That’s some serious extra impact!
6. Event conversion rate
What is it?
Event conversion rate shows what percentage of your event attendees went from being a guest to a donor (or boosted their donation) after attending. This metric is perfect for seeing how well your team follows up with event participants.
How do you calculate it?
To calculate your event conversion rate, simply divide the number of attendees who donated or increased their donation after the event by the total number of attendees. Then, multiply by 100 to get your percentage.
Example of KPI in action
You organized a charity run and 120 people signed up. After the event, you track who donated or increased their donation. You find that 60 participants donated or increased their giving after crossing the finish line.
Here’s the math:
60 / 120 = 0.50
0.50 x 100 = 50%
Your event conversion rate is 50%—half of your event attendees gave or increased their donation after participating in the run!
7. Pledge fulfillment percentage
What is it?
Pledges are promises to donate to your nonprofit over time. The pledge fulfillment percentage tells you how many donors are sticking to their word and following through with their contributions.
You want to know if those pledges are coming through. Because if they’re not, your accounting team might be in for a surprise! If pledged funds don’t show up, your budget could be off. If donors are backing out often, it might be time to rethink how you’re securing those pledges.
How do you calculate it?
To calculate the pledge fulfillment percentage, divide the total pledges fulfilled by the total pledges promised, then multiply by 100 to get your percentage.
Example of KPI in action
Imagine you are running a fundraising campaign for a community garden project. Before the campaign, donors pledged to contribute a certain amount for every new plant adopted. After the campaign wraps up, you want to check how many people actually paid up on their pledges. You see that 500 pledges were made, and 450 were fulfilled.
Here’s the math:
450 / 500 = 0.90
0.90 x 100 = 90%
Your pledge fulfillment rate is 90%—meaning 90% of your pledged donations became a reality. That’s a strong follow-through!
8. Recurring gift percentage
What is it?
The recurring gift percentage shows you how much of your total donations come from donors who set up recurring gifts. You measure the impact of your recurring gift program and get a glimpse of the steady cash flow coming in…even if you can’t fully count it in next year’s budget.
Example of KPI in action
Let’s say your nonprofit received 2,500 donations in a year, and 750 of those were recurring gifts. Here’s the math:
750 / 2,500 = 0.3
0.3 x 100 = 30%
Your recurring gift percentage is 30%! That means 30% of your donations came from donors who are committed to giving regularly. That’s a fantastic foundation for future fundraising!
9. Board member participation rate

What is it?
Many nonprofits ask board members to contribute personally each year. The board member participation rate shows you what percentage of your board is stepping up.
As key leaders, you want your board members fully invested in the organization. This metric helps you have a strong fundraising conversation with them.
How do you calculate it?
To calculate your board member participation rate, divide the number of contributing board members by the total number of board members, then multiply by 100 to get a percentage.
Example of KPI in action
Let’s say you have 10 board members, and 8 of them make a personal contribution each year. Here’s the math:
8 / 10 = 0.8
0.8 x 100 = 80%
Your board member participation rate is 80%! That’s a strong showing of commitment from your board. Keep that momentum going!
10. Non-donation revenue
What is it?
To ensure your nonprofit thrives long-term, you need a diverse revenue mix you can count on annually. This way, if economic changes, shifts in donor priorities, or other factors affect donations, you’re still covered.
Here are some common ways nonprofits earn non-donation revenue:
- Grants: Seek out grants from governments, companies, and foundations to fund specific programs or initiatives. Just be ready to research, propose, and report transparently!
- Swag offerings: Sell branded merch like t-shirts, mugs, and tote bags. It’s a win-win—extra funds and free marketing when supporters wear or use your items!
- Fundraising eCards: Boost your website with eCards that let donors send holiday or birthday greetings while supporting your cause. It’s an easy and fun way to engage.
- Membership dues: Create a membership program where donors pay an annual fee for exclusive benefits, like members-only resources, early event access, and discounts.
By tracking these funding sources, you can see if you’re diversifying your revenue. If you’re too reliant on donations, it’s time to shift focus and build out these other revenue streams.
Example of KPI in action
Let’s say your nonprofit earned the following over the past six months:
• $8,000 in grant funding
• $400 in merchandise sales
• $700 through fundraising eCards
• $2,500 in membership dues
Now, let’s calculate your non-donation revenue:
$400 + $2,500 + $700 + $8,000 = $11,600
That’s your non-donation revenue for the past six months! If your donation revenue for the same period was $25,000, you might consider putting more effort into diversifying your revenue sources to make your funding more balanced.
11. Fundraising pipeline velocity
What is it?
Fundraising pipeline velocity measures how quickly potential donors move from first contact to making a donation. It helps assess the efficiency of donor cultivation efforts.
How do you calculate it?
Divide the total amount of donations in the pipeline by the number of donors and the average time (in days) it takes to convert a prospect into a donor.
Example of KPI in action
If it takes an average of 60 days for a donor to make their first gift and the total pipeline value is $100,000 across 50 potential donors, pipeline velocity helps understand fundraising efficiency.
Here’s the math:
(100.000/50) ×60 =33.3 (dollars per day per donor)
Donor relationship KPIs
Where would your nonprofit be without its donors? Probably nowhere! You know that building and keeping strong relationships with donors is key to success. These donor relationship metrics will show you how well you’re doing and give you the perfect starting point for improvement!
12. Donor retention rate
What is it?
The donor retention rate tells you how many of your donors stick around from year to year. The higher your retention rate, the better! It means you’re keeping those donors happy and engaged, saving you from constantly having to find new ones.
Tracking your retention rate gives you major insights, like:
• How well are your communication channels working?
• Whether your donor recognition efforts are on point.
• Which donation methods do returning donors prefer?
If your retention rate isn’t where you want it, check your stewardship practices. How are you acknowledging your donors? When do you follow up? How often do you keep in touch? That’s where you should start when improving donor retention.
How do you calculate it?
To calculate your donor retention rate, divide the number of donors who gave last year and this year by the number of donors who gave last year. Then multiply by 100 to get your percentage.
Simple and powerful!
Example of KPI in action
Let’s say you had 100 donors last year, and 30 of those donors came back to donate this year. That means you “retained” 30 of your 100 donors. Here’s the math:
30 / 100 = 0.3
0.3 x 100 = 30%
Your donor retention rate is 30% this year. Time to keep those donors coming back!
13. Lapsed donor rate
What is it?
Your lapsed donor rate shows you the percentage of your donors who didn’t return this year. It’s also called the donor churn rate.
A high churn rate? That’s a red flag! It means you need to dig into your donor retention efforts, like recognition programs and engagement campaigns, to see where things might be slipping.
How do you calculate it?
To find your lapsed donors for the year, start by identifying the donors from last year. Any who didn’t donate this year is considered lapsed. Then, divide the number of lapsed donors by the number of donors from last year. Multiply by 100 to get the percentage. Easy math, big insights!
Example of KPI in action
Let’s say you had 150 donors last year, and 50 of them donated again this year. That means 100 did not return. So, your lapsed or churned donors are 100. Now, let’s do the math:
100 / 150 = 0.666
0.666 x 100 = 66.6%
Your donor churn rate is 66.6%. Looks like it’s time to take a closer look at how to re-engage those donors and keep them coming back!
14. Donor growth rate
What is it?
Donor growth rate tracks how your total number of donors changes over time. It’s a “domino metric,” meaning if it’s down, other metrics might be, too! Tracking donor growth keeps you on top of your performance, so you can spot any issues early and take action fast.
Use this metric along with others to figure out exactly why your donor numbers aren’t growing as expected.
How do you calculate it?
To find your donor growth rate, subtract the number of donors last year from the number of donors this year. Then divide that number by the number of donors last year. Multiply by 100 to get your percentage.
Example of KPI in action
Let’s say you had 500 donors last year, and this year you have 600 donors. Here’s how to calculate your growth rate:
600 – 500 = 100
100 / 500 = 0.2
0.2 x 100 = 20%
Your donor growth rate is 20%—you’ve grown your donor base by 20%.
15. Donor lifetime value (DLV)

What is it?
Donor lifetime value (DLV) is all about measuring the total value a donor brings to your organization over time. But this number is about the overall value of a group of donors. It’s perfect for deciding where to focus your efforts and which campaigns to run.
How do you calculate it?
To calculate DLV, you’ll need three key numbers:
• Average length of time as an active donor (also known as donor lifespan)
• Average donation amount
• Average frequency of donation
To find the DLV, just multiply those three averages together:
The average length of time X average donation amount X average frequency of donation.
Example of KPI in action
Let’s say you want to compare the DLV of donors who give through monthly subscriptions versus one-time donors to see which group has the higher value over time.
Here’s how you would break it down:
Monthly donors:
- Average length of time as an active donor: 3 years
- Average donation amount: $50 per month
- Average donation frequency: 12 times a year
One-time donors:
- Average length of time as an active donor: 1 year
- Average donation amount: $200
- Average donation frequency: 1 time per year
Now, calculate the DLV for each group:
For monthly donors:
3 years x $50 x 12 = $1,800
For one-time donors:
1 year x $200 x 1 = $200
In this hypothetical example, your DLV for monthly donors is $1,800, while the DLV for one-time donors is $200. This shows you that monthly donors bring in far more value over time. Time to focus on building that monthly donor base!
16. Number of donors by type
What is it?
Fundraising diversity—also known as diversity of fundraising sources—gives you a snapshot of who’s supporting your organization. It shows the mix of donor types, such as:
- Individuals
- Foundations
- Government
- Corporations
Knowing where your donations come from helps you spot growth areas and plan your next fundraising move.
How do you calculate it?
No complicated math here…just count how many donors come from each category!
Example of KPI in action
Imagine you have:
• 267 individual donors
• 4 corporate sponsors or donors
• 3 foundations supporting your work
Now you’ve got a clear picture of your fundraising diversity! Time to mix it up and focus on growing those sources!
17. Donor acquisition cost
What is it?
Donor acquisition cost (DAC) tells you how much it costs to bring in a new donor. This number is super helpful when comparing different channels, campaigns, or time frames. If one channel has a lower DAC, you’ve got a solid case to invest more in that channel!
How do you calculate it?
Just divide the amount spent on donor acquisition by the number of new donors you brought in.
Example of KPI in action
Let’s say you spent $5,000 on donor acquisition in a certain campaign, and you brought in 150 new donors. Here’s the math:
$5,000 / 150 = $33.33 per new donor
So, your DAC is $33.33. Now you have the info to see where you’re getting the best bang for your buck!
18. Demographic metrics
What is it?
Tracking basic demographics like age, location, gender, or profession helps you get the inside scoop on your donor base. It’s like knowing the story behind the numbers!
How do you calculate it?
No math is needed here! Just count how many donors fall into each demographic group.
Example of KPI in action
For example, your nonprofit might have:
• 115 donors aged 20-30
• 190 donors aged 40-50
• 420 donors aged 50-60
And you might know that:
• 65% of your donors are female, and 35% are male.
• Most of your donors are from the US and Canada.
19. Donor journey completion rate
What is it?
The percentage of potential donors who complete all steps in a fundraising funnel (e.g., from awareness to donation). It helps track engagement across the donor journey.
How do you calculate it?
Divide the number of donors who complete all steps by the total number who started the process, then multiply by 100.
Example of KPI in action
If 1,000 people engage with your campaign, but only 300 complete a donation, this rate shows donor drop-off.
Here’s the math:
(300/1000) ×100=30%
Giving level metrics
Metrics that track giving levels show you how much funding is coming in. Once you know how much money you’re pulling in, you can level up your strategies and raise even more!
20. Gift frequency

What is it?
Gift frequency tells you how often your donors give within a set time period, like a year. It’s a powerful way to measure how engaged your supporters are!
How do you calculate it?
To find your gift frequency, just add up the total number of donations in your set time period. Then, divide that by the number of donors you have.
Example of KPI in action
Let’s say you’re looking at a year of donations. You have 300 active donors, and over the year, they made a total of 450 donations. Some gave once; others gave multiple times.
Now, calculate the gift frequency:
450 / 300 = 1.5
Your gift frequency is 1.5. That means each donor gave, on average, one and a half times throughout the year. Perfect opportunity to keep those donors coming back.
21. Average gift size
What is it?
The average gift size shows you how much, on average, donors are giving in a specific group, campaign, or time period. It’s a metric to track regularly so you can see if your gifts are growing, holding steady, or shrinking.
You can measure it in different ways:
• Track it year-over-year for the same event to see how things are progressing.
• Measure it across all events in a year (or even multiple years) to see which events bring in the most.
• Track it over a fixed period (like six months or a year) to spot general trends.
Tracking average gift size is a pointer to evaluating how well your fundraising and major gift efforts work.
How do you calculate it?
To calculate the average gift size, just divide the total donations by the number of gifts you received.
Example of KPI in action
Let’s say you want to calculate the average gift size for the past year. You received 120 donations, and the total amount raised is $6,000.
Here’s how you calculate it:
$6,000 / 120 = $50
Your average gift size for the year is $50. This gives you a clear picture of what your typical donor is contributing.
22. Average giving capacity
What is it?
In fundraising, leaving money on the table means settling for a smaller donation when you could have asked for—and gotten—a bigger one.
The secret to avoiding this? Know your donors’ giving capacity—how much they can actually give. You’re on the right track if your average gift size and average giving capacity are closely aligned!
How do you calculate it?
To figure out the donor’s giving capacity, look at three key factors:
• Their connection to your cause
• Their philanthropic history
• Wealth markers (basically, how much they can afford to give)
Once you’ve got that, you can estimate each donor’s giving capacity. Then, calculate the average for your entire donor pool by adding up each donor’s giving capacity and dividing it by the total number of donors.
You might calculate:
• The average giving capacity across your entire donor base.
• The average giving capacity for a certain donor group, comparing it with what they’ve actually donated.
Example of KPI in action
Let’s say you’re calculating the average giving capacity of four major donors.
- Donor A: $150,000
- Donor B: $90,000
- Donor C: $120,000
- Donor D: $110,000
To find the average:
$150,000 + $90,000 + $120,000 + $110,000 = $470,000
$470,000 / 4 = $117,500
So, the average giving capacity for these four donors is $117,500. Now you have a clear idea of what to ask for!
23. Average gift size growth
What is it?
Average gift size growth shows the percent increase in your average donation size from year to year. This is a great way to understand your donor relationships. If your donor numbers are growing, but your average gift size isn’t, it might be time to focus more on cultivating your current donors rather than just bringing in new ones.
How do you calculate it?
To calculate average gift size growth, subtract last year’s average gift size from this year’s average. Then, divide that by last year’s average gift size. Multiply by 100 to get the percentage.
In other words:
Avg. gift size growth = (Avg. gift size this year – Avg. gift size last year) / (Avg. gift size last year) x 100
Example of KPI in action
Last year, your nonprofit’s average gift size was $120. This year, it’s $140. Let’s calculate the growth!
140 – 120 = 20
20 / 120 = 0.167
0.167 x 100 = 16.67%
Your average gift size growth is 16.67%—great progress! Now, keep engaging those donors and watch those numbers continue to climb.
Engagement metrics
Keeping your donors engaged is the secret sauce to raising more funds! When donors feel connected to your nonprofit and know you value them, they’re way more likely to open their wallets.
24. Frequency of contact with donors
What is it?
Also known as outreach rate, this metric shows how often your team is reaching out to donors within a set time. It’s an answer to finding the sweet spot for donor engagement. Too many calls? You risk annoying them. Too few? You might lose them.
It’s most helpful to track this across donor groups. For example, compare how often you contact donors who give frequently vs. those who don’t give as much. See if there’s a pattern!
Remember, it’s not just about the number of contacts but the types:
- Phone calls
- In-person chats at events
- Meetings
- Emails
Each touchpoint matters, so make sure you’re tracking them accurately without mixing apples and oranges.
How do you calculate it?
The frequency of contact is simply the number of interactions over a set time period.
Example of KPI in action
Let’s say your team reaches out to major donors 8 times a year via phone. Or maybe your outreach rate for all donors is 15 times a year or once a month. Keep those numbers in check!
25. Fundraising participation rate

What is it?
As peer-to-peer fundraising and all kinds of a-thons get more and more popular, tracking your fundraising participation rate has never been more important!
This metric tells you how many attendees or donors didn’t just show up or donate—they fundraised too. For example, if someone pays to enter your road race, they’re not a fundraiser. But, if they raise pledges on top of their entry fee, they’re a fundraiser!
If your participation rate isn’t as high as you’d like, that’s your cue to ramp up the marketing.
Event attendees, who donate and fundraise? Total gems. Tracking this rate helps you spot opportunities and make sure you’re not missing out on potential fundraisers.
How do you calculate it?
To calculate the fundraising participation rate, divide the number of attendees or donors who fundraised by the total number of attendees or donors.
Example of KPI in action
Let’s say you hosted a charity walk with 200 attendees. However, only 120 of those participants fundraised on your behalf prior to the event.
Here’s how you calculate the fundraising participation rate:
120 / 200 = 0.60
0.60 x 100 = 60%
Your fundraising participation rate for the walk is 60%. That means 60% of your attendees went the extra mile and fundraised, too.
26. Asks made
What is it?
Asks made refers to the number of times your team directly asks for donations from a donor or group of donors. You can zoom in even more by focusing on specific campaigns or time periods for more targeted data.
This metric shows how active your fundraising efforts are. Want to know if more asks lead to more donations? Compare the number of asks made with your conversion rates to find your sweet spot for outreach!
How do you calculate it?
No fancy calculations needed! Just track the number of times your team asks for donations during a certain period or campaign.
Let’s say you’re looking at your end-of-year campaign and you count all the fundraising asks your team made. You find that your team made 1,567 asks during the campaign.
Now you’ve got the data to see if those asks turned into more donations.
27. Event attendance rate
What is it?
The percentage of invited guests who attend a fundraising event. It helps measure event engagement and effectiveness.
How do you calculate it?
Divide the number of attendees by the number of invitees and multiply by 100.
Example of KPI in action
If you invite 500 people to a charity gala and 250 attend, your attendance rate helps assess interest.
Here’s the math:
250/500 ×100=50%
28. SMS response rate
What is it?
The percentage of recipients who reply to a fundraising SMS campaign. It measures donor engagement through text messaging.
How do you calculate it?
Divide the number of responses by the number of SMS messages sent and multiply by 100.
Example of KPI in action
If you send 1,000 fundraising texts and 150 people reply, this KPI shows text engagement.
Here’s the math:
(150/1000) ×100=15%
29. Peer-to-Peer fundraising success rate
What is it?
The percentage of peer-to-peer fundraising campaigns that reach or exceed their donation goal. It measures the effectiveness of supporter-led fundraising efforts.
How do you calculate it?
Divide the number of successful peer-to-peer campaigns by the total number of campaigns and multiply by 100.
Example of KPI in action
If 120 peer-led fundraising pages were created and 90 reached their goal, this metric reflects campaign effectiveness.
Here’s the math:
(90/120) ×100=75%
30. Text-to-Give conversion rate
What is it?
The percentage of people who complete a donation after receiving a text-to-give prompt.
How do you calculate it?
Divide the number of successful text donations by the total number of text prompts sent and multiply by 100.
Example of KPI in action
If you send 5,000 text-to-give messages and 500 people donate, this metric reflects effectiveness.
Here’s the math:
(500/5000) ×100=10%
Online performance KPIs
With so much fundraising happening online these days, it’s crucial to keep track of how your nonprofit is performing in the digital space! These KPIs will help you measure everything, from your online donation page to your email campaigns.
31. Online gift percentage
What is it?
Online gift percentage shows you how much of your fundraising comes from online donations compared to other sources, like events or mail-in donations.
If your online gift percentage is lower than expected or behind your peers, it might be time to pump up your digital marketing and email efforts! You can also use this data to plan your marketing strategy for the future, adjusting your budget based on which channels are pulling in the most donations.
How do you calculate it?
To calculate online gift percentage, just divide the number of online donations by the total number of donations, then multiply by 100 to get your percentage.
Example of KPI in action
Let’s say you received 1,000 donations over the past quarter, and 620 of those came from online donations. Here’s the math:
620 / 1,000 = 0.62
0.62 x 100 = 62%
Your online gift percentage is 62%! This shows that more than half of your donations are coming through digital channels. Looks like it’s time to keep building on that online momentum!
32. Email open rate
What is it?
Email open rate measures how many people actually open the email you sent, whether it’s for a campaign, newsletter, or request.
Tracking your open rate is a game-changer for email marketing! Once you have your baseline, try tweaking one thing at a time, like:
• The subject line
• The sender’s name/email address
• The time you send it
Testing and tracking these changes will give you the numbers to back up what works and what doesn’t, helping you craft the best email strategy possible!
How do you calculate it?
To calculate the email open rate, divide the number of people who opened the email by the total number of recipients. Then, multiply by 100 to get the percentage.
Example of KPI in action
Let’s say you sent out 1,200 emails to a group of potential donors for an upcoming fundraising campaign. Out of those 1,200 recipients, 480 people opened the email. Here’s how you calculate the open rate:
480 / 1,200 = 0.4
0.4 x 100 = 40%
Your email open rate for this campaign is 40%. Now, you can use this data to experiment and see if tweaking your subject line or sending time can give you an even more considerable boost next time!
33. Email click-through rate
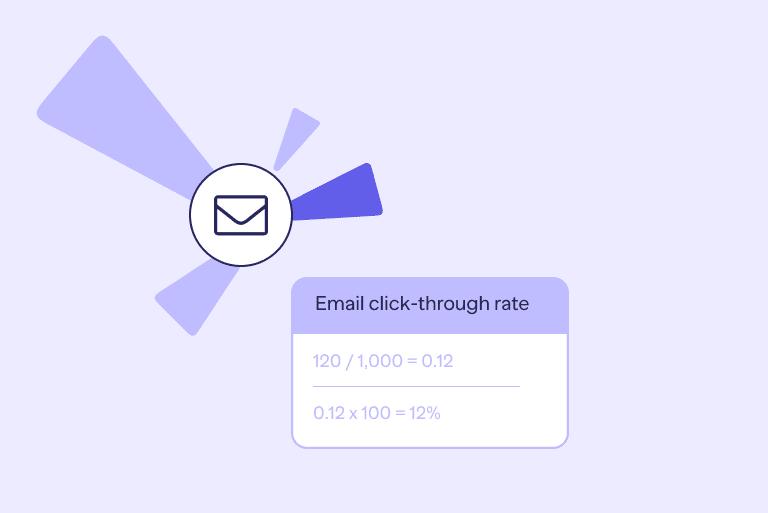
What is it?
Email click-through rate tells you the percentage of people who click on links in your emails to check out other pages, like your website or donation page. This is a powerhouse metric when paired with email open rates and conversion rates, helping you spot where your marketing can improve.
If your click-through rate is low, try moving your calls-to-action (CTAs) to more visible spots or making your emails more personalized by segmenting your donors smartly.
How do you calculate it?
To find your email click-through rate, divide the number of people who clicked a link by the total number of emails delivered. Then multiply by 100 to get the percentage.
Example of KPI in action
Imagine sending a fundraising email to 1,000 subscribers. Out of those, 120 click on the link to your donation page. Here’s how you calculate the click-through rate:
120 / 1,000 = 0.12
0.12 x 100 = 12%
Your email click-through rate for this campaign is 12%. That’s a solid start! Now, try experimenting with different CTAs or even testing out email designs to boost those clicks even higher next time!
34. Email opt-out rate
What is it?
The email opt-out rate shows how many of your email subscribers hit the “unsubscribe” button. Too many unsubscribes? That’s a red flag! When that happens, your emails can get tagged as spam and end up in the dreaded junk folder.
Tracking this rate helps you catch opt-outs early so you can tweak your emails and keep your communication on point.
How do you calculate it?
To find your email opt-out rate, divide the number of unsubscribes by the total number of emails sent. Then, multiply that number by 100 to get your percentage.
Example of KPI in action
Let’s say you sent 2,000 emails for your year-end fundraising campaign. Of those 2,000, 100 people unsubscribed. Here’s how you calculate your email opt-out rate:
100 / 2,000 = 0.05
0.05 x 100 = 5%
Your email opt-out rate is 5%. That’s a manageable number! Still, you might want to explore why some unsubscribed and tweak your email approach to keep it low next time.
35. Website page views
What is it?
Website page views tell you how many times pages on your website were accessed. It’s not how many people, but how many times pages were viewed—so if someone checks a page 10 times, those views add up!
Page views are especially helpful when paired with other digital metrics like email open rates and click-through rates. If you’ve got high open rates, high clicks, but low conversions, it might mean your website content or design needs a little improvement.
How do you calculate it?
No math is needed here! Just use tools like Google Analytics to track the number of page views.
Example of KPI in action
Let’s say you sent 2,000 emails for your year-end fundraising campaign. Of those 2,000, 100 people unsubscribed. Here’s how you calculate your email opt-out rate:
100 / 2,000 = 0.05
0.05 x 100 = 5%
Your email opt-out rate is 5%. That’s a manageable number! Still, you might want to explore why some unsubscribed and tweak your email approach to keep it low next time.
Let’s say your nonprofit has a donation page and an impact story page. Over the past month, you track the page views:
- The donation page has 2,000 views.
- The impact story page has 3,500 views.
With those numbers, you can see interest in your impact stories, but the donation page views might suggest some room to improve on encouraging donations. The next step? Try to make that donation page more enticing!
36. Landing page conversion rate
What is it?
The landing page conversion rate tells you how many visitors to your page actually complete the goal action, like donating or downloading something. You worked hard to get them there—now you want them to take action!
If your conversion rate is lower than expected that’s a sign it’s time to optimize your landing page. Maybe your donation form is too long or confusing. Streamline it and watch that rate go up!
How do you calculate it?
To calculate your landing page conversion rate, divide the number of visitors who completed the goal action by the total number of visitors to the page. Multiply that by 100 to get the percentage.
Example of KPI in action
Let’s say your nonprofit donation page had 5,000 visitors last week. Out of those, 1,500 people completed donations. Here’s how you calculate the conversion rate:
1,500 / 5,000 = 0.3
0.3 x 100 = 30%
Your landing page conversion rate is 30%. Now you know that one-third of visitors took action. Time to optimize that page and make it even more enticing!
37. Amplification rate
What is it?
Amplification rate shows you how often your followers are sharing your content. It’s the key to understanding how far your social media content is spreading through their networks.
The higher the amplification rate, the more people are helping spread the word. That’s a win for your cause!
How do you calculate it?
To calculate amplification rate, divide the number of shares by the total number of followers on the platform. Then, multiply by 100 to get the percentage.
Example of KPI in action
Imagine your nonprofit has 50,000 followers on Instagram. You post about an upcoming volunteer opportunity, and the post gets shared 12,500 times. Here’s the math for your amplification rate:
12,500 / 50,000 = 0.25
0.25 x 100 = 25%
Your amplification rate is 25%. That means one-quarter of your followers are sharing your post—great reach! Keep those shares coming!
38. Applause rate
What is it?
Applause rate shows you how many people liked, shared, or gave positive reactions to a post compared to how many followers you have. This helps you know what kinds of posts get the most love on each platform!
How do you calculate it?
To find your applause rate, divide the number of approval actions (likes, shares, etc.) by your number of followers. Then multiply by 100 to get the percentage.
Example of KPI in action
You posted a heartwarming photo on Instagram of your team packing care packages for a local charity event. The post gets 120 likes and 30 shares, and you have 500 followers. Here’s how you calculate the applause rate:
(120 + 30) / 500 = 0.30
0.30 x 100 = 30%
Your applause rate for this post is 30%! Your audience is loving it—time to keep that engagement rolling!
39. Google ads click-through rate

What is it?
Google Ads Click-Through Rate (CTR) is all about how many people click on your ads to visit your landing page, like your donation form or volunteer sign-up page. A high CTR means your ad is on point—people see it, like it, and click through!
You need a CTR of 5% every month to keep your Google Ad Grant. It’s a big deal to make sure your ads are on target and attract the right audience.
How do you calculate it?
To manually calculate CTR, divide the number of clicks your ad got by how many times it showed up in search results. Then, multiply by 100 to get the percentage.
Example of KPI in action
You run a Google Ad campaign for your nonprofit’s volunteer program. Your ad received 3,000 impressions, and 180 people clicked on the link to sign up. Here’s how you calculate the CTR:
180 / 3,000 = 0.06
0.06 x 100 = 6%
Your CTR is 6%, which is fantastic! It means your ad resonates with the right audience and drives traffic to your volunteer sign-up page. Keep up the great work!
40. Social media conversion rate
What is it?
Social media conversion rate is your key to understanding how many people take action (like donating) after clicking a link from your social media post. It’s about turning those clicks into real results!
Knowing this rate helps you see where your website visitors are coming from and how they’re completing important actions—whether that’s donating, signing up for your newsletter, or something else!
How do you calculate it?
To find your social media conversion rate, divide the number of conversions from social media by the total number of visitors to your page. Then, multiply by 100 to get your percentage.
Example of KPI in action
Imagine you launched a new campaign to promote your volunteer sign-up page on social media. Over the course of a month, 10,000 people visited the page, and 2,500 signed up to volunteer. Out of those 2,500, 1,200 came directly from your social media posts.
Here’s how you calculate your social media conversion rate:
1,200 / 10,000 = 0.12
0.12 x 100 = 12%
Your social media conversion rate is 12%—awesome! Social media is clearly driving volunteers to your sign-up page. Keep up the great engagement!
41.Social media shares per campaign
What is it?
The total number of times a fundraising campaign is shared on social media, reflecting organic reach and supporter engagement.
How do you calculate it?
Sum the total number of shares across all social media platforms.
Example of KPI in action
If a fundraising campaign receives 2,000 shares across Facebook, Twitter, and Instagram, this metric quantifies its reach.
Here’s the math:
Shares on Facebook + Shares on Twitter + Shares on Instagram +…
Total Shares=800+700+500=2,000
42.Cart abandonment rate
What is it?
The percentage of potential donors who start the online donation process but do not complete it. This metric highlights possible friction in the giving experience.
How do you calculate it?
Subtract the number of completed donations from the number of donation form visits, divide by the number of form visits, and multiply by 100.
Example of KPI in action
If 500 people visit your donation form, but only 200 complete the donation, your abandonment rate shows lost potential revenue.
Here’s the math:
(500−200/500) x 100=60%
KPI Formulas
Here’s a quick recap of all of the formulas mentioned above.
| Metric Name | Formula |
|---|---|
| Cost per dollar raised | Total fundraising expenses / total funds raised |
| Fundraising return on investment | Net revenue / fundraising expenses |
| Conversion rate | (Amount of donations / number of donations appeals sent) × 100 |
| Gifts secured | Total number of gifts received |
| Matching gift rate | (Number of matching gifts / total number of gifts) × 100 |
| Event conversion rate | (Number of donations from event attendees / total event attendees) × 100 |
| Pledge fulfillment percentage | (Total fulfilled pledges / total pledges made) × 100 |
| Recurring gift percentage | (Number of recurring donors / total donors) × 100 |
| Board member participation rate | (Number of participating board members / total board members) × 100 |
| Non-donation revenue | Total revenue from non-donation sources |
| Fundraising pipeline velocity | Total pipeline value / (number of prospects × time to convert) |
| Donor retention rate | (Number of repeat donors / number of donors last year) × 100 |
| Lapsed donor rate | (Number of lapsed donors / total donors last year) × 100 |
| Donor growth rate | ((New donors – lapsed donors) / total donors last year) × 100 |
| Donor lifetime value | Average donation amount × average donor lifespan × average donations per year |
| Number of donors by type | Count of donors categorized by type (e.g., major, one-time, recurring) |
| Donor acquisition cost | Total acquisition costs / number of new donors acquired |
| Demographic metrics | Donor data categorized by age, location, income, etc. |
| Donor journey completion rate | (Number of completed donor journeys / started donor journeys) × 100 |
| Gift frequency | Total number of gifts / total number of donors |
| Average gift size | Total donation amount / total number of gifts |
| Average giving capacity | Estimated giving potential based on donor data and wealth indicators |
| Average gift size growth | ((Current average gift size – previous average gift size) / previous average gift size) × 100 |
| Frequency of contact with donors | Total donor contacts / number of donors |
| Fundraising participation rate | (Number of active participants / total potential participants) × 100 |
| Asks made | Total number of donations asks |
| Event attendance rate | (Amount of attendees / number of invitees) × 100 |
| SMS response rate | (Number of SMS responses / SMS messages sent) × 100 |
| Peer-to-Peer fundraising success rate | (Number of successful peer campaigns / total peer campaigns) × 100 |
| Text-to-Give conversion rate | (Number of successful text donations / text messages sent) × 100 |
| Online gift percentage | (Total online donations / total donations) × 100 |
| Email open rate | (Number of opened emails / number of emails sent) × 100 |
| Email click-through rate | (Number of clicked links / number of emails sent) × 100 |
| Email opt-out rate | (Number of unsubscribed users / number of emails sent) × 100 |
| Website page views | Total number of page views on fundraising pages |
| Landing page conversion rate | (Number of donations from landing page / number of visitors) × 100 |
| Amplification rate | (Number of shares per post / number of followers) × 100 |
| Applause rate | (Number of positive reactions (likes, favorites) / number of followers) × 100 |
| Google ads click-through rate | (Number of ad clicks / number of ad impressions) × 100 |
| Social media conversion rate | (Number of donations from social media / number of social media visitors) × 100 |
| Cart abandonment rate | ((Donation form visits – completed donations) / donation form visits) × 100 |
| Social media shares per campaign | Total number of shares across platforms |
Steps to start tracking fundraising performance metrics
Ready to dive into tracking online fundraising metrics (aka KPIs)? It’s simple!
- Pick a CRM
- Choose one key metric to track
- Pull a report
- Spot any patterns or anomalies
- Set a reminder to pull the report again
Now, I know we’ve been talking all about performance measures, but here’s the trick: you don’t want to spend your entire week pulling the same numbers over and over again.
That’s where RallyUp comes in!
RallyUp has the most advanced, user-friendly dashboards and reporting tools in the game. Let the tech handle the grind so you can focus on what matters!
Here’s just a taste of what you can do with RallyUp:
8X Online revenue
Organizations using Rallyup raise 8X more online
2X Recurring Revenue Growth
Organizations using Rallyup grow recurring revenue 2X faster
+13% Donor Retention Rates
Organizations using Rallyup have a 13% higher donor retention rate
Use RallyUp to track KPIs
Your fundraising platform should make tracking KPIs a piece of cake. RallyUp does just that with powerful tools to sort your donor and donation data in tons of different ways.
And with RallyUp’s reporting features, you can easily pull custom reports with the exact info you need.
It’s your nonprofit’s call to decide which metrics matter most. Start by looking at your mission, vision, and strategy. Then, pick KPIs for each goal. These numbers will guide your success, so make sure you’re consistent in measuring them—whether it’s weekly, monthly, or on your own schedule!
Would you like recommendations on which metrics to prioritize based on your specific fundraising goals?
RallyUp expert support will help you develop a fundraising strategy that perfectly aligns with your needs. Contact us today and find out how!

For more articles on fundraising metrics and KPIs, read:
- Calculating your cost per dollar raised: a guide for nonprofits
- What is Conversion Rate? How to Calculate and Use Conversion Rate
- How nonprofits maximized their conversion rate with RallyUp
- What is the Gifts Secured Metric? How to calculate and use GSM
- What is the Matching Gift Rate metric? How to calculate and use MGR