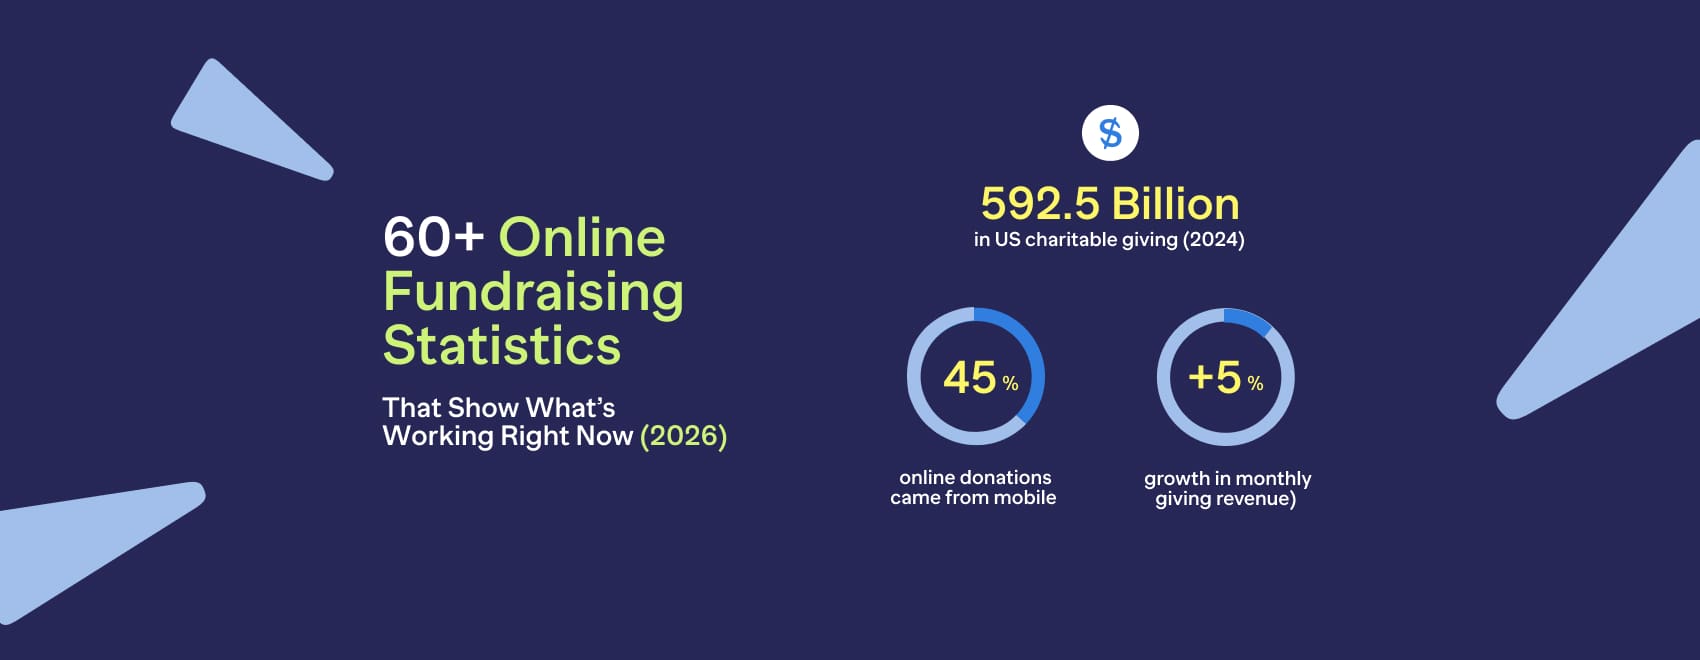
50+ Online Fundraising Statistics That Show What’s Working Right Now (2026)
Key Online Fundraising Trends to Know
- Mobile giving leads: 45% of all online donations now come from mobile devices.
- Recurring donors give more: Monthly donations account for 31% of online revenue, and recurring donors give 42% more annually.
- Email is still relevant: Email drives 28% of all nonprofit revenue online.
- Social media converts: 55% of people who engage with nonprofit content take action afterward.
- Design drives donations: Responsive design sees 126% more mobile donations than non-optimized sites.
- Smart fundraising: Leverage online fundraising with RallyUp (end-to-end fundraising software) to raise and save more for your mission in 2026.
There was a time when your nonprofit received checks in the mail or cash donations. Then online giving entered the scene, and donors started making gifts through websites and donation forms. Over the years, mobile giving and social media have become major fundraising channels.
Today? A donor sees a post about your cause, taps a button, and their gift is done in under a minute.
What worked even a year ago may not work the same way now. The platforms your donors use, the causes they support, how they prefer to give – it’s all moving toward faster, more accessible online options.
If you don’t know what’s driving those donations right now, you’re missing real opportunities.
Let’s examine the top online fundraising statistics that reveal exactly what’s working and where donors are actually giving.
In this article
- The state of online fundraising today
- Donation pages and website performance
- Mobile fundraising trends
- Email fundraising performance statistics
- Social media fundraising statistics
- Peer-to-peer and community fundraising statistics
- Recurring giving and retention statistics
- Final takeaway: Turn these insights into results with RallyUp
- FAQs on online fundraising
The state of online fundraising today
In the US, charitable giving reached $592.50 billion in 2024. Interestingly, online fundraising continues to grow and plays a significant role in how givers support causes, and donor behavior statistics confirm this.
People are choosing online giving because it fits how they already live their lives. It removes friction and enhances reach, so donating becomes a quick decision that one can act on instantly.
But how exactly is online giving growing? The numbers below break it down.

Online fundraising growth
- Digital fundraising grew by 2% in 2024, after a 1% decline in 2023 (2024; M+R Benchmarks 2025)
- Small nonprofits rely more on online giving. Online donations account for 13.4% of their total revenue, compared to 8.3% for medium organizations and 4.1% for large nonprofits. (2024; Blackbaud Institute)
- 67% of nonprofits worldwide now accept online donations. (2024; nonprofitssource)
Online donation size and frequency
- The average desktop donation is $118, tablet donations average $96, and mobile donations average $79. (2025; Double the Donation)
- 38% of donors who donate online return to donate again to the same nonprofit the following year. (2024; Nonprofitssource)
How donors prefer to give online
- 39% of donors prefer giving online with a credit card, followed by PayPal (17%), debit card (13%), Apple Pay (11%), Venmo (8%), ACH (6%), and Google Pay (5%). (2025; Nonprofit Tech for Good: The Communication & Giving Preferences of 641 Online Donors).
- 33% of donors say email most inspires them to give, followed by social media at 29%, websites at 17%, and print at 9%. (2025; Nonprofit Tech for Good: The Communication & Giving Preferences of 641 Online Donors)
- 47% of donors participate in online raffles or sweepstakes for nonprofits, 45% buy from nonprofit online stores, 34% give to crowdfunding campaigns, and 24% donate through online auctions. (2024; M+R Benchmarks 2025)
- PayPal is the most common alternative payment method, available on 76% of nonprofit donation pages. (2024; M+R Benchmarks 2025)
- Apple Pay is offered by 47% of nonprofits, and Google Pay is available on 40% of donation pages.
Donation pages and website performance
Your donation page does more than just collect gifts. It’s the final step in convincing someone to give, and every detail matters. A form that takes too long to load, asks for too much information, or doesn’t offer multiple payment options can send people away before they even finish.
The statistics below show exactly why these details matter:
- Desktop accounts for 55% of donation transactions and brings in 70% of revenue. (2024; M+R Benchmarks 2025)
- On average, nonprofits raise $1.29 per website visitor, and 1.5% of visitors complete a donation. (2024; M+R Benchmarks 2025)
- Websites with responsive design see 126% more donations on mobile devices compared to sites without mobile optimization. (2024; Nonprofitssource)
- Embedding custom-branded donation pages directly on the website, rather than redirecting to a third-party page, helps raise six times as much money. (2024; Nonprofitssource)
- Donation pages convert at about 11% on desktop and 8% on mobile, meaning roughly 9 out of 10 visitors leave without giving. (2024; M+R Benchmarks 2025)
Tips to optimize donation forms for conversion
Most visitors abandon donation forms before completing their gift. Here’s how to improve your form and keep donors moving toward checkout:
- Limit form fields: Only ask for essential information upfront. Each additional field decreases conversion, so save optional questions for post-donation.
- Optimize your donation amounts: Set your default suggested amounts strategically. $50 is the most common donation across campaign types, so anchor around that.
- Show real-time donation activity: Display a live feed of recent donations with names and amounts to create urgency and social validation.
- Add the regular giving upsell: This single feature can increase overall fundraising by 6.5% by converting one-time donors to monthly supporters at the moment of peak engagement.
- Use trust signals: Add security badges, testimonials, or your charity registration number near the payment section to reassure donors that the transaction is safe.
- Set up abandoned cart emails: Track incomplete donations and send automatic follow-up reminders with a small incentive to recover gifts that would otherwise be lost.
- Make your CTA stand out: Use a single, prominent donate button with high-contrast colors and action-oriented copy like “Donate Now,” rather than a generic Submit.
Mobile fundraising trends
Mobile giving isn’t just optional anymore; it’s how most of your supporters interact with your nonprofit online. Donors check their phones constantly, and when they see something that moves them, they want to give right then.

This shift in behavior can clearly be seen through the following numbers.
- 45% of all online donation transactions in 2024 were made on mobile devices. (2025; Nonprofit Tech for Good: The Communication & Giving Preferences of 641 Online Donors)
- Mobile devices (phones and tablets) accounted for 53% of nonprofit website visits. (2024; M+R Benchmarks 2025)
- The number of completed transactions through mobile devices increased by 50% in 2024. (2025; Double the Donation)
- 1 in 4 donors use mobile devices to discover nonprofits they weren’t aware of before. (2024; Nonprofitssource)
- 64% of mobile donations come from women. (2024; Nonprofitssource)
- 90% of text message reminders are read within 3 minutes. (2024; Nonprofitssource)
How to improve the mobile giving experience?
Getting mobile giving right is not just about making your site fit the small screen. Here’s what actually works:
- Make the “Donate” path obvious: Use one clear primary button, strong contrast, and a layout that works one-handed.
- Offer fast payment options: Include digital wallets and express checkout so donors can give without typing card details.
- Reduce load time: Compress images, avoid heavy pop-ups, and keep the donation page lightweight.
- Use mobile-friendly fields: Enable autofill, set the keyboard type to number pad (phone or card), and clear error messages.
- Reassure donors quickly: Add brief trust cues near the form, then confirm the donation instantly with a receipt message.
- Test the full flow end-to-end: Check it on multiple phones and browsers, from the first click to the confirmation screen.
Email fundraising performance statistics
Email is one of the most direct and cost-effective ways to reach donors. When someone subscribes to your list, you’re connecting with people who already care about your cause and want to hear from you.

Here’s what the data shows about email performance and why you must invest in this channel:
Email marketing revenue and engagement
- Email directly drove 11% of online revenue in 2024, even as email fundraising nonprofit revenue declined year over year. (2024; M+R Benchmarks 2025).
- Nonprofits earned $58 per 1,000 fundraising emails sent in 2024. (2024; M+R Benchmarks 2025)
- The average nonprofit brings in $1.11 per email subscriber. Small organizations see $6.15 per contact, while large nonprofits average $0.88. (Neon One Nonprofit Email Report)
- 48% say email is their preferred method for receiving updates and fundraising appeals from organizations. (Neon One Nonprofit Email Report)
- Fundraising email click-through rate averaged 0.48%. (2024; M+R Benchmarks 2025)
- Automated welcome email open rates are around 80%. (SmartInsights)
Note: Open rates are no longer dependable due to inbox privacy features that inflate them. For performance tracking, focus on clicks, donation-page completion, conversion, and revenue per subscriber.
Email volume and frequency
- Nonprofits send an average of 66 emails per subscriber. (2024; Nonprofitssource)
- 86% of nonprofits send email newsletters. Of those, 45% send monthly, 24% quarterly, 13% weekly, and 9% twice monthly. (2025; Nonprofit Tech for Good: The Communication & Giving Preferences of 641 Online Donors)
Email personalization
- Personalized emails have average open rates that are more than 82% higher than those of generic emails. (2025; Double the Donation)
- Personalizing your call to action increases conversion rates by 202% compared to generic ones. (HubSpot)
- Emails with personalized subject lines are 26% more likely to be opened. (Experian via Campaign Monitor)
Social media fundraising statistics
Social media is no longer just an awareness or community channel but has become a direct fundraising channel where people can give without leaving the app. Instagram and Facebook have built-in donation tools that make giving quick and easy.
But performance varies depending on where your supporters spend their time and how you reach them.
Platform usage and giving behavior
- 34% of donors say Facebook is the platform they find most helpful for staying informed about their favorite nonprofits’ campaigns and updates, followed by Instagram (29%), LinkedIn (22%), X (5%), YouTube (4%), and TikTok (3%). (2025; Nonprofit Tech for Good: The Communication & Giving Preferences of 641 Online Donors)
- 29% of donors say social media is what motivates them most to give. (2025; Nonprofit Tech for Good: The Communication & Giving Preferences of 641 Online Donors)
- 52% of online donors say they’d be willing to promote their favorite nonprofits’ campaigns on social media if asked, committing to spend 1-2 hours per month. (2025; Nonprofit Tech for Good: The Communication & Giving Preferences of 641 Online Donors)
- TikTok audiences grew the fastest in 2024, with follower counts jumping by 37% on average. (2024; M+R Benchmarks 2025)
- More than half (55%) of people who interact with nonprofit content on social media go on to take action – with 59% making a financial gift, 53% volunteering, and 43% attending community events. (2024; Nonprofitssource)
Facebook fundraising
- 38% of online donors have given to a nonprofit through Facebook, and 70% say they plan to give through the platform again. (2025; Nonprofit Tech for Good: The Communication & Giving Preferences of 641 Online Donors)
- Facebook Fundraising Tools accounted for 0.2% of total online revenue for nonprofits in 2024, down from 1.1% in 2023. (2024; M+R Benchmarks)
- A typical Facebook fundraiser collects three separate gifts averaging $36 each, totaling $108. (2024; M+R Benchmarks)
Instagram fundraising
- 12% of online donors have given through Instagram, and 83% say they plan to give through the platform again. (2025; Nonprofit Tech for Good: The Communication & Giving Preferences of 641 Online Donors)
- 75% Instagram users take an action, whether that’s clicking through to a website or completing a purchase after seeing a nonprofit ad. (2024; Nonprofitssource)
- About 30% of nonprofits are actively using Instagram to generate donations and build awareness. (2024; Nonprofitssource)
YouTube for nonprofits
- After watching a nonprofit video, 57% of viewers make a donation. (2024; Nonprofitssource)
- Within a month of watching one nonprofit video, 68% of viewers watch additional similar content. (2024; Nonprofitssource)
- Videos that get the most views typically run between 31 and 60 seconds. (2024; Nonprofitssource)
X (Formerly known as Twitter) engagement
- More than half (55%) of people who engage with nonprofits on Twitter take some form of action afterward. (2024; Nonprofitssource)
- On Giving Tuesday, Twitter users send 700% more traffic to donation pages compared to a regular day. (2024; Nonprofitssource)
- Posts with images get 18% more clicks, 89% more likes, and 150% more shares than text-only posts. (2024; Nonprofitssource)
Don’t spread yourself thin across every platform. Pick up to 2 platforms based on your team’s capacity and your donors’ preferences, then commit to showing up consistently
Build a content rhythm, test what drives action (not just likes), and track which platform actually converts to donations. Once you’ve established a solid presence and understand what works, then consider expanding.
Peer-to-peer and community fundraising statistics
Peer-to-peer fundraising and crowdfunding tap into the power of your supporter network, turning them into active fundraisers for your cause. When done well, they bring new donors into the fold while strengthening connections with existing ones.
Let’s see through these numbers the exact benefits they bring:
Peer fundraising
- One in ten donors from the US and Canada take part in peer-to-peer fundraising. (2024; Nonprofitssource)
- Facebook drives between 15% and 18% of all donations in typical peer-to-peer campaigns. (2024; Nonprofitssource)
- Event fundraisers for walks, runs, and cycling who send more than 15 emails raise 76% more revenue than those who don’t use email outreach. (2025; Double the Donation)
Crowdfunding and community campaigns
- 34% of donors contribute to nonprofit crowdfunding campaigns. (2025; Double the Donation)
- Nonprofits using crowdfunding raise an average of $9,200 per campaign. (2024; Nonprofitssource)
- On average, eight people donate to an individual crowdfunding campaign. (2024; Nonprofitssource)
- The average donation to a crowdfunding campaign is $66. (2024; Nonprofitssource)
- Campaigns that reach 30% of their goal within the first week are more likely to succeed. (2024; Nonprofitssource)
- There’s an average 35% increase in giving when crowdfunding campaigns display a progress thermometer. (2024; Nonprofitssource)
Recurring giving and retention statistics
Recurring donors are some of the most valuable supporters a nonprofit can have. They give consistently, stick around longer, and contribute more over time than one-time donors.
Even better, monthly giving is steadily rising over the years, and the following data shows why nonprofits must make it a priority.
Monthly giving growth and revenue
- Monthly giving revenue grew by 5% in 2024 and made up 31% of all online revenue. (2024; M+R Benchmarks 2025)
- The average monthly donation is $24.(M+R Benchmarks 2025 and Nonprofit Tech for Good)
- The average monthly online donation is $52 ($624 per year) compared to the average one-time gift of $128. (2024; Nonprofitssource)
Donor enrollment and retention
- 45% of donors are enrolled in a monthly giving program. (2024; Nonprofitssource)
- 94% of recurring donors want to give monthly, 3% weekly, 2% annually, and 1% quarterly. (2025; Double the Donation)
- 38% of donors who make an online gift to a nonprofit make another online gift to that same nonprofit the following year. (2025; Double the Donation)
- Donors who set up recurring donations give 42% more each year than those who make one-time donations. (2024; Nonprofitssource)
- 91% of donors use a credit card for their monthly gifts, 8% use ACH, and 1% use PayPal. (2025; Nonprofit Tech for Good)
Final takeaway: Turn these insights into results with RallyUp
Online fundraising isn’t optional anymore. Yet only 67% of nonprofits worldwide accept online donations. That means one in three organizations still aren’t set up to meet donors where they already are, giving your nonprofit a clear edge.
To move forward, stop treating online fundraising as a single donation form or website. Build your approach around donor behavior. Identify the channels your supporters actually use, then show up there consistently with a clear message and an easy path to donate.
RallyUp’s end-to-end fundraising platform gives you one place to handle it all. You can create multiple online campaigns and find built-in tools to manage everything from setup to execution.
Whether you need expert guidance or want a team to handle campaign setup for you, RallyUp helps you raise more without the usual headaches.
FAQs on online fundraising
Set a clear goal, define your donor audience, create a simple donation flow, and run consistent outreach with strong follow-up.
Peer-to-peer campaigns, virtual events, crowdfunding, social media fundraisers, and online auctions are common online fundraising ideas.
Yes, small nonprofits can succeed with online fundraising by focusing on ease of giving, donor relationships, and consistent outreach rather than large budgets.
Low conversion, limited reach, trust barriers, and weak donor retention are the most common challenges.